

SpecFlow vs UR: Product Radar & Bar Charts
Two Shopify apps, side by side: detected stores, momentum, reviews, plans, listed features and who runs each. Store counts as of Oct 14, 2026 for SpecFlow, Oct 13, 2026 for UR.
The short answer
- Only SpecFlow lists a free plan. Paid plans start at $9.99/month for SpecFlow and $3.99/month for UR.
Head to head


Free
- · 3 visual themes
- · Global spec table
- · Storefront app block
- · Table layout
- · Up to 5 rows & columns
Pro
- · Custom CSS & JavaScript
- · Custom theme & fonts
- · Everything in Free
- · File attachments (PDFs)
- · Per-product spec overrides
- · Unlimited rows & columns
Growth
- · Bulk CSV import/export
- · Everything in Pro
- · Geo-shipping banner
- · Priority support
- · Tabs & Accordion layouts
- · Variant-specific specs
Basic Plan
- · Annual plan: 2 months free!
- · Free 7-day trial after install
Coverage counts what each App Store listing names. Every feature, checked off app by app, is in Shoplist.
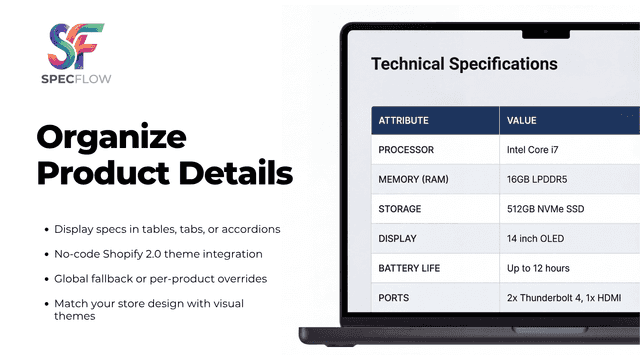
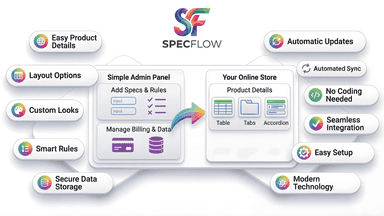
See every featureSpecFlow organizes complex product info into structured tables, tabs, or accordions. Display technical details clearly without cluttered descriptions. You can apply a global spec table across your entire catalog or set specific overrides per product. Built natively on Shopify metafields, it operates entirely within your store without external dependencies.
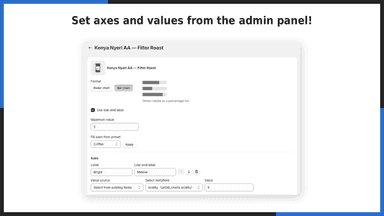
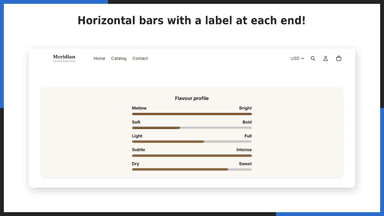
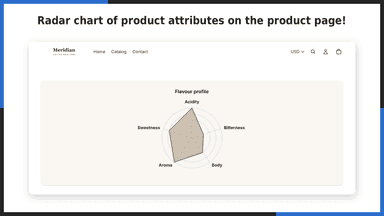
Coffee, sake, wine, cosmetics: some products are easier to grasp as a picture than as a table. Set 1 to 8 attributes per product and show them as a radar chart or as horizontal bars on the product page. Values are stored in product metafields, so you can edit them with Matrixify or any bulk tool you already use. Define axes once on a collection and every product in it inherits them while keeping its own values.
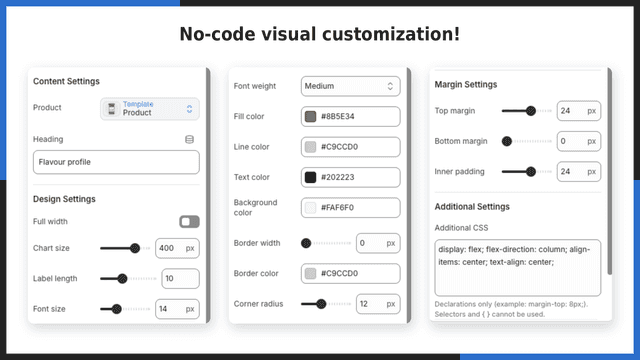
- Display specifications in custom table, tab, or accordion layouts.
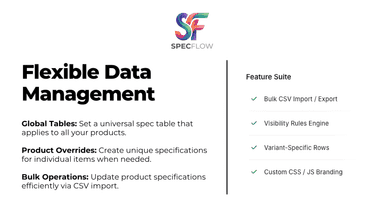
- Set a global specification table for all items or customize per product.
- Show or hide specific details using conditional visibility rules.
- Assign different specification rows to specific product variants.
- Show product attributes as a radar chart with 3 to 8 axes.
- Switch to horizontal bars with a pair of labels at each end.
- Values live in product metafields, so bulk tools can edit them.
- Set axes once on a collection and each product shows its own values.

All the numbers
Every figure, side by side
A green dot marks the app ahead on a measured figure. Estimates, gaps and apps that leave no storefront trace never take the lead.
Adoption
| Measure |  SpecFlow |  UR |
|---|---|---|
| Detected stores | Not published | Not published |
| Net store change, 28 days | 0 | 0 |
| Stores added, 28 days | Not enough data | Not enough data |
| Big-brand share | Not enough data | Not enough data |
| Top store categories | Not published | Not published |
| Top store countries | Not published | Not published |
Reviews
| Measure | SpecFlow | UR |
|---|---|---|
| App Store rating | Not published | Not published |
| App Store reviews | Not published | Not published |
| New reviews, 28 days | Not enough data | Not enough data |
| Reviewers a year or more in | Not enough data | Not enough data |
FAQ
SpecFlow and UR: common questions
- Is SpecFlow or UR cheaper?
- Only SpecFlow lists a free plan. Paid plans start at $9.99/month for SpecFlow and $3.99/month for UR. Shoplist compares base prices only between monthly plans in the same currency; usage charges and annual plans vary, so check each plan’s limits.
- Where does this comparison’s data come from?
- Shoplist crawls Shopify storefronts to detect which apps each store runs, and reads each app’s Shopify App Store listing for reviews, pricing, features and integrations. Store counts are as of Oct 14, 2026 for SpecFlow, Oct 13, 2026 for UR; estimated figures are labeled.
How Shoplist compares apps
Store counts come from Shoplist’s crawl of Shopify storefronts, which detects the apps each store runs; they are as of Oct 14, 2026 for SpecFlow, Oct 13, 2026 for UR. Reviews, ratings, plans, features and integrations come from each app’s Shopify App Store listing. 28-day figures are labeled when estimated, and a figure that is missing or estimated never decides who leads. Read the methodology.