

Juicy Profit Analytics vs Sweet Analytics and Reporting
Two Shopify apps, side by side: detected stores, momentum, reviews, plans, listed features and who runs each. Store counts as of Nov 19, 2026 for Juicy Profit Analytics, Oct 13, 2026 for Sweet Analytics and Reporting.
The short answer
- On the Shopify App Store: Juicy Profit Analytics 4.9 from 107 reviews and Sweet Analytics and Reporting 5.0 from 36 reviews.
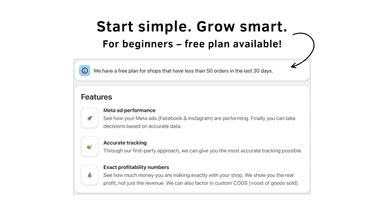
- Both list a free plan. Paid plans start at $29/month for Juicy Profit Analytics and $129/month for Sweet Analytics and Reporting.
- Juicy Profit Analytics lists 9 features Sweet Analytics and Reporting’s listing doesn’t mention, including Analytics dashboard, Custom dashboards, Custom reports.
Head to head


- Sweden
- United States
- Germany
Momentum
New reviews each month
Review pace is the clearest public read on how fast an app is winning new merchants.
Free
- · Advanced COGS Rules
- · Analyze profits, costs, and ad spend
- · Connect Claude AI via MCP
- · Connect multiple stores
- · Premium Support
- · Preserve historical profit data
Starter
- · Advanced COGS Rules
- · Analyze profits, costs, and ad spend
- · Connect Claude AI via MCP
- · Connect multiple stores
- · Premium Support
- · Preserve historical profit data
Advanced
- · Advanced COGS Rules
- · After 500 orders / month
- · Analyze profits, costs, and ad spend
- · Connect Claude AI via MCP
- · Connect multiple stores
- · Premium Support
Free Plan
- · Access to key sales dashboards
- · Customer Summary dashboard
- · Free forever
- · Google Analytics (GA3 + GA4 consolidated reporting)
Pro Starter
- · All Sweet Dashboards
- · Basic Sweet Support
- · Sales revenue band up to $1.2m in the last 12 months
- · Unlimited Integrations
Pro Tier 1
- · Basic Sweet Support
- · Sales revenue band up to $5m in the last 12 months
Pro Tier 2
- · Basic Sweet Support
- · Sales revenue band up to $8m in the last 12 months
Coverage counts what each App Store listing names. Every feature, checked off app by app, is in Shoplist.
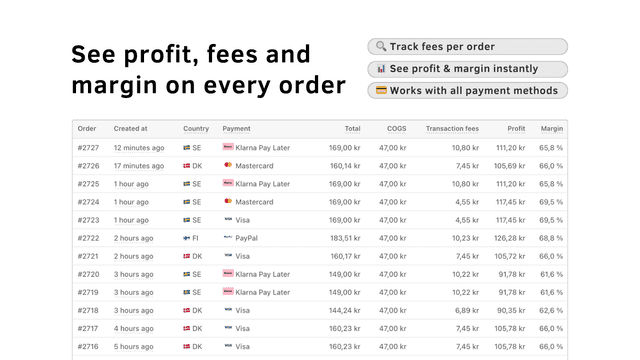
See every featureJuicy Profit Analytics gives you true net profit tracking, costs, and ad attribution in one profit dashboard. Attribute every sale to the exact ad and campaign that drove it, analyze profit margins with COGS and shipping cost rules, and track profitability down to the order level, including UTM tracking. Track recurring expenses and 3PL costs with a profit tracker that preserves historical data when costs change.
Sweet Analytics is built for retailers by retailers. We can help you deliver an improved ROI on marketing spend. Our retail analytics tool delivers insights & actions and will help you answer these key questions: - What is driving your sales? - Which of your marketing channels are most effective? - How many customers do you need to acquire to retain?
- Analyze profits, costs, and ad spend to optimize your business decisions.
- Track ad performance with attribution to find top-performing campaigns.
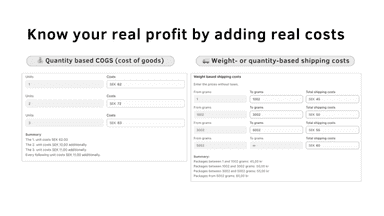
- Add quantity-based custom COGS for detailed and accurate profitability tracking.
- Set shipping costs by weight or quantity for accurate per-order calculations.
- Use our growth modelling tool to forecast customer acquisition & marketing spend
- Real time campaign performance & integrate direct mail activities with online
- Build audiences & export segments to email marketing or social media platforms
- Reconcile attribution numbers back to your sales numbers


All the numbers
Every figure, side by side
A green dot marks the app ahead on a measured figure. Estimates, gaps and apps that leave no storefront trace never take the lead.
Adoption
| Measure |  Juicy Profit Analytics |  Sweet Analytics and Reporting |
|---|---|---|
| Detected stores | 1,205 | Not published |
| Net store change, 28 days | +27 | 0 |
| Stores added, 28 days | 68 | Not enough data |
| Big-brand share | 6% | Not enough data |
| Top store categories | Apparel & Accessories, Health & Beauty, Home & Garden | Not published |
| Top store countries | Sweden, United States, Germany | Not published |
Reviews
| Measure | Juicy Profit Analytics | Sweet Analytics and Reporting |
|---|---|---|
| App Store rating | 4.9 ★ | 5.0 ★(ahead) |
| App Store reviews | 107(ahead) | 36 |
| New reviews, 28 days | 9(ahead) | 0 |
| Reviewers a year or more in | 5% | Not enough data |
Pricing
| Measure | Juicy Profit Analytics | Sweet Analytics and Reporting |
|---|---|---|
| Free plan | Yes | Yes |
| Lowest paid monthly plan | $29/month(ahead) | $129/month |
| Longest free trial | 10 days | 14 days |
| Plans listed | 3 | 4 |
Listing
| Measure | Juicy Profit Analytics | Sweet Analytics and Reporting |
|---|---|---|
| Shopify category rank | #6(ahead) | #121 |
| Shopify App Charts | #21 in Analytics | Not on this week’s charts |
| Built for Shopify | Yes | No |
| Launched | Apr 9, 2025 | Aug 25, 2022 |
| Languages | 1 | 1 |
| Developer | Easyapps | Sweet Analytics |
FAQ
Juicy Profit Analytics and Sweet Analytics and Reporting: common questions
- Is Juicy Profit Analytics or Sweet Analytics and Reporting cheaper?
- Both list a free plan. Paid plans start at $29/month for Juicy Profit Analytics and $129/month for Sweet Analytics and Reporting. Shoplist compares base prices only between monthly plans in the same currency; usage charges and annual plans vary, so check each plan’s limits.
- Which has better reviews, Juicy Profit Analytics or Sweet Analytics and Reporting?
- On the Shopify App Store: Juicy Profit Analytics 4.9 from 107 reviews and Sweet Analytics and Reporting 5.0 from 36 reviews.
- What features does each app list that the other doesn’t?
- Juicy Profit Analytics lists 9 the others don’t mention, such as Analytics dashboard, Custom dashboards, Custom reports, Marketing attribution. A feature missing from a listing may still be supported; this compares what each App Store listing says.
- Where does this comparison’s data come from?
- Shoplist crawls Shopify storefronts to detect which apps each store runs, and reads each app’s Shopify App Store listing for reviews, pricing, features and integrations. Store counts are as of Nov 19, 2026 for Juicy Profit Analytics, Oct 13, 2026 for Sweet Analytics and Reporting; estimated figures are labeled.
How Shoplist compares apps
Store counts come from Shoplist’s crawl of Shopify storefronts, which detects the apps each store runs; they are as of Nov 19, 2026 for Juicy Profit Analytics, Oct 13, 2026 for Sweet Analytics and Reporting. Reviews, ratings, plans, features and integrations come from each app’s Shopify App Store listing. 28-day figures are labeled when estimated, and a figure that is missing or estimated never decides who leads. Read the methodology.