
Sweet Analytics and Reporting Shopify App: Reviews, Pricing & Alternatives
Key signals for Sweet Analytics and Reporting
Shoplist has not found Sweet Analytics and Reporting on a storefront yet, so it tracks the app through its 36 public reviews, pricing, and listing changes instead. Storefront detections will appear here as soon as Shoplist finds them. Checked .
Sonar hasn’t found Sweet Analytics and Reporting on a storefront yet. Admin-only and server-side apps rarely leave a storefront trace.
Sweet Analytics and Reporting on the Shopify App Store
Shoplist reads Sweet Analytics and Reporting’s App Store listing every day: where it ranks, what merchants say, what it charges and every edit it ships.
Where Shopify ranks Sweet Analytics and Reporting
Shoplist reads Shopify’s full category listings every day, so a climb or a slip shows up the day it happens.
| Day | Analytics | Operations |
|---|---|---|
| Sep 3, 2026 | #145 | #286 |
| Sep 4, 2026 | #145 | #286 |
| Sep 5, 2026 | #114 | #287 |
| Sep 6, 2026 | #116 | #288 |
| Sep 7, 2026 | #118 | #288 |
| Sep 8, 2026 | #119 | — |
| Sep 9, 2026 | #120 | #288 |
| Sep 10, 2026 | #119 | #288 |
| Sep 11, 2026 | #119 | #288 |
| Sep 12, 2026 | #120 | #288 |
| Sep 13, 2026 | #135 | #289 |
| Sep 14, 2026 | #137 | #289 |
| Sep 15, 2026 | #149 | #289 |
| Sep 17, 2026 | #150 | #288 |
| Sep 19, 2026 | #148 | #289 |
| Sep 20, 2026 | #150 | #289 |
| Sep 21, 2026 | #152 | #289 |
| Sep 22, 2026 | #148 | #289 |
| Sep 23, 2026 | #149 | #287 |
| Sep 24, 2026 | #150 | #287 |
| Sep 25, 2026 | #154 | #287 |
| Sep 26, 2026 | #154 | #285 |
| Sep 27, 2026 | #154 | #283 |
| Sep 28, 2026 | #154 | #284 |
| Sep 29, 2026 | #154 | #283 |
| Sep 30, 2026 | #102 | #283 |
| Oct 1, 2026 | #99 | #285 |
| Oct 2, 2026 | #104 | #287 |
| Oct 3, 2026 | #103 | #286 |
| Oct 4, 2026 | #158 | #285 |
| Oct 5, 2026 | #123 | #286 |
| Oct 6, 2026 | #122 | #286 |
| Oct 7, 2026 | #142 | #288 |
| Oct 8, 2026 | #153 | #286 |
| Oct 9, 2026 | #157 | #287 |
| Oct 10, 2026 | #158 | #287 |
| Oct 11, 2026 | #157 | #289 |
| Oct 12, 2026 | #156 | #286 |
| Oct 13, 2026 | #159 | #289 |
| Oct 14, 2026 | #156 | #285 |
| Oct 15, 2026 | #158 | #290 |
| Oct 16, 2026 | #150 | #292 |
| Oct 17, 2026 | #152 | #291 |
| Oct 18, 2026 | #153 | #292 |
| Oct 19, 2026 | #152 | #292 |
| Oct 20, 2026 | #154 | #292 |
| Oct 21, 2026 | #153 | #292 |
| Oct 22, 2026 | #152 | — |
| Oct 23, 2026 | #107 | #290 |
| Oct 24, 2026 | #106 | #294 |
| Oct 25, 2026 | #118 | #293 |
| Oct 31, 2026 | #140 | #294 |
| Nov 1, 2026 | #143 | #294 |
| Nov 2, 2026 | #141 | #295 |
| Nov 4, 2026 | #138 | #294 |
| Nov 5, 2026 | #121 | #294 |
| Nov 6, 2026 | #138 | #294 |
| Nov 7, 2026 | #138 | #294 |
| Nov 8, 2026 | #139 | #295 |
| Nov 9, 2026 | #139 | #295 |
| Nov 10, 2026 | #164 | #293 |
| Nov 11, 2026 | #160 | #292 |
| Nov 12, 2026 | #141 | #289 |
| Nov 13, 2026 | #112 | #290 |
| Nov 14, 2026 | #112 | #290 |
| Nov 15, 2026 | #113 | #288 |
| Nov 16, 2026 | #114 | #289 |
| Nov 17, 2026 | #110 | #288 |
| Nov 18, 2026 | #111 | #288 |
| Nov 19, 2026 | #109 | #286 |
What merchants say about Sweet Analytics and Reporting
The verdict from its App Store reviews, and whether the merchants who leave them stay.
5.0
Sweet Analytics and Reporting review momentum
New reviews follow new installs, so a rising month is Sweet Analytics and Reporting winning merchants in public.
- March 2025: 16 reviews
- April 2025: 2 reviews
- June 2025: 2 reviews
- July 2025: 1 reviews
- August 2025: 4 reviews
- September 2025: 1 reviews
- December 2025: 1 reviews
- January 2026: 1 reviews
- March 2026: 1 reviews
- April 2026: 1 reviews
- May 2026: 2 reviews
- June 2026: 1 reviews
What Sweet Analytics and Reporting charges
Free plan available. Every plan on its listing, and every price change Shoplist has caught, so you can see exactly how it packages and prices.
Free Plan
Free
Pro Starter
$129/month
Pro Tier 1
$399/month
Pro Tier 2
$999/month
Every edit Sweet Analytics and Reporting ships to its listing
Titles, prices, screenshots and featured spots, diffed line by line. A competitor’s listing edits are its strategy, in public.
Developer name changed +4 more
Description rewritten +1 more
How Sweet Analytics and Reporting sells itself on the App Store
The pitch, integrations and features merchants see before they install: the positioning a competitor is betting on.
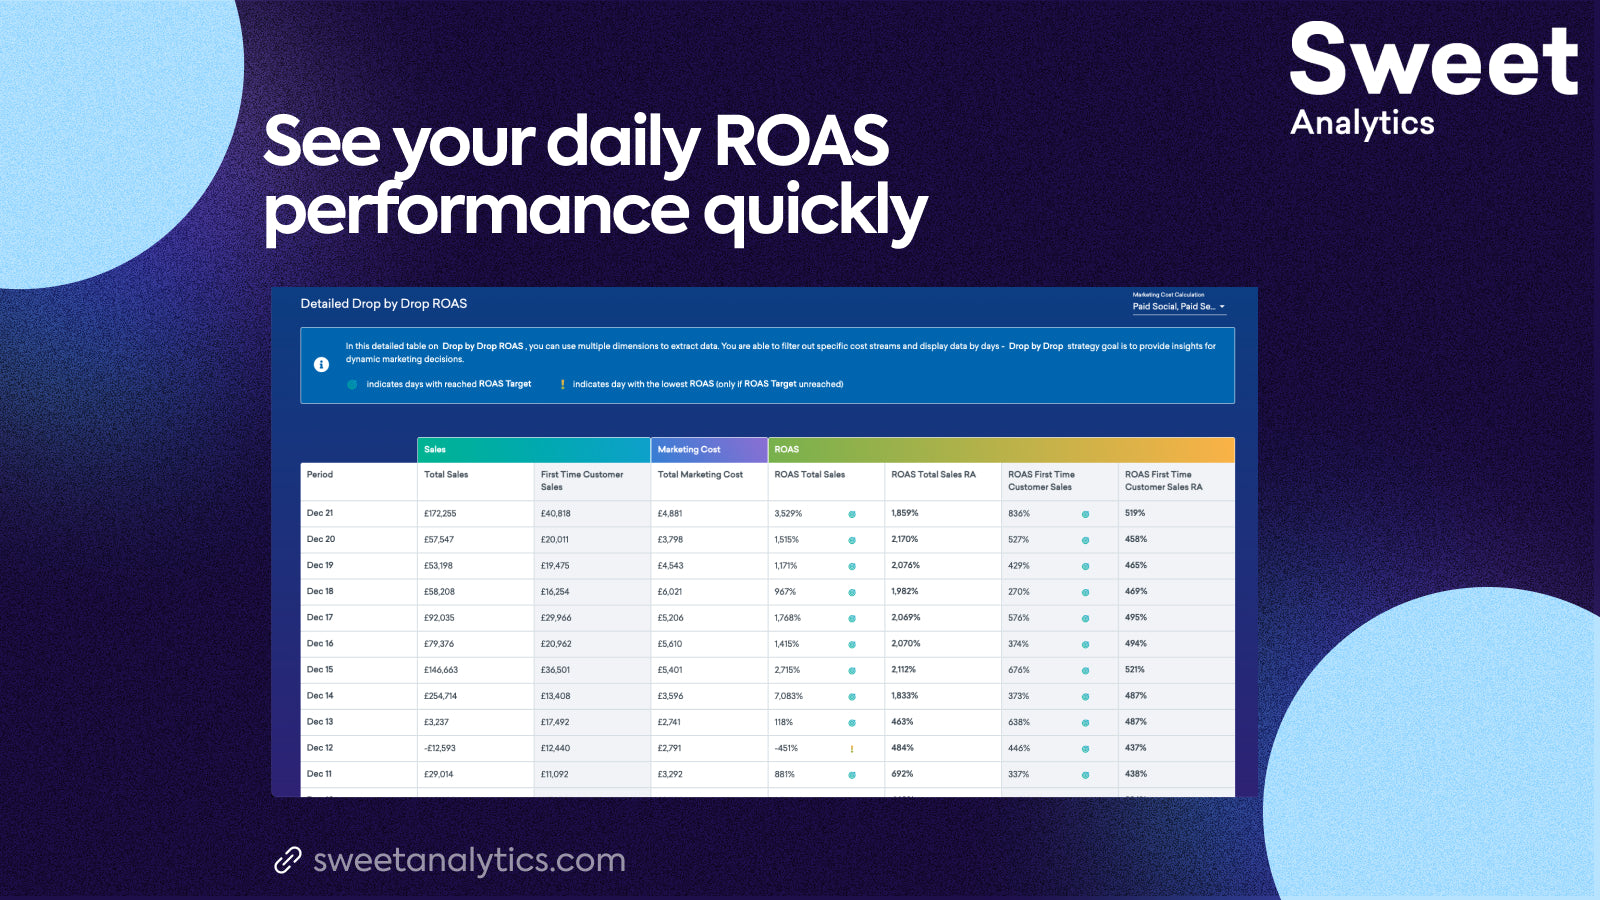
“Sweet Analytics is a leading marketing analytics tool that helps eCommerce retailers grow revenue.”
What it does
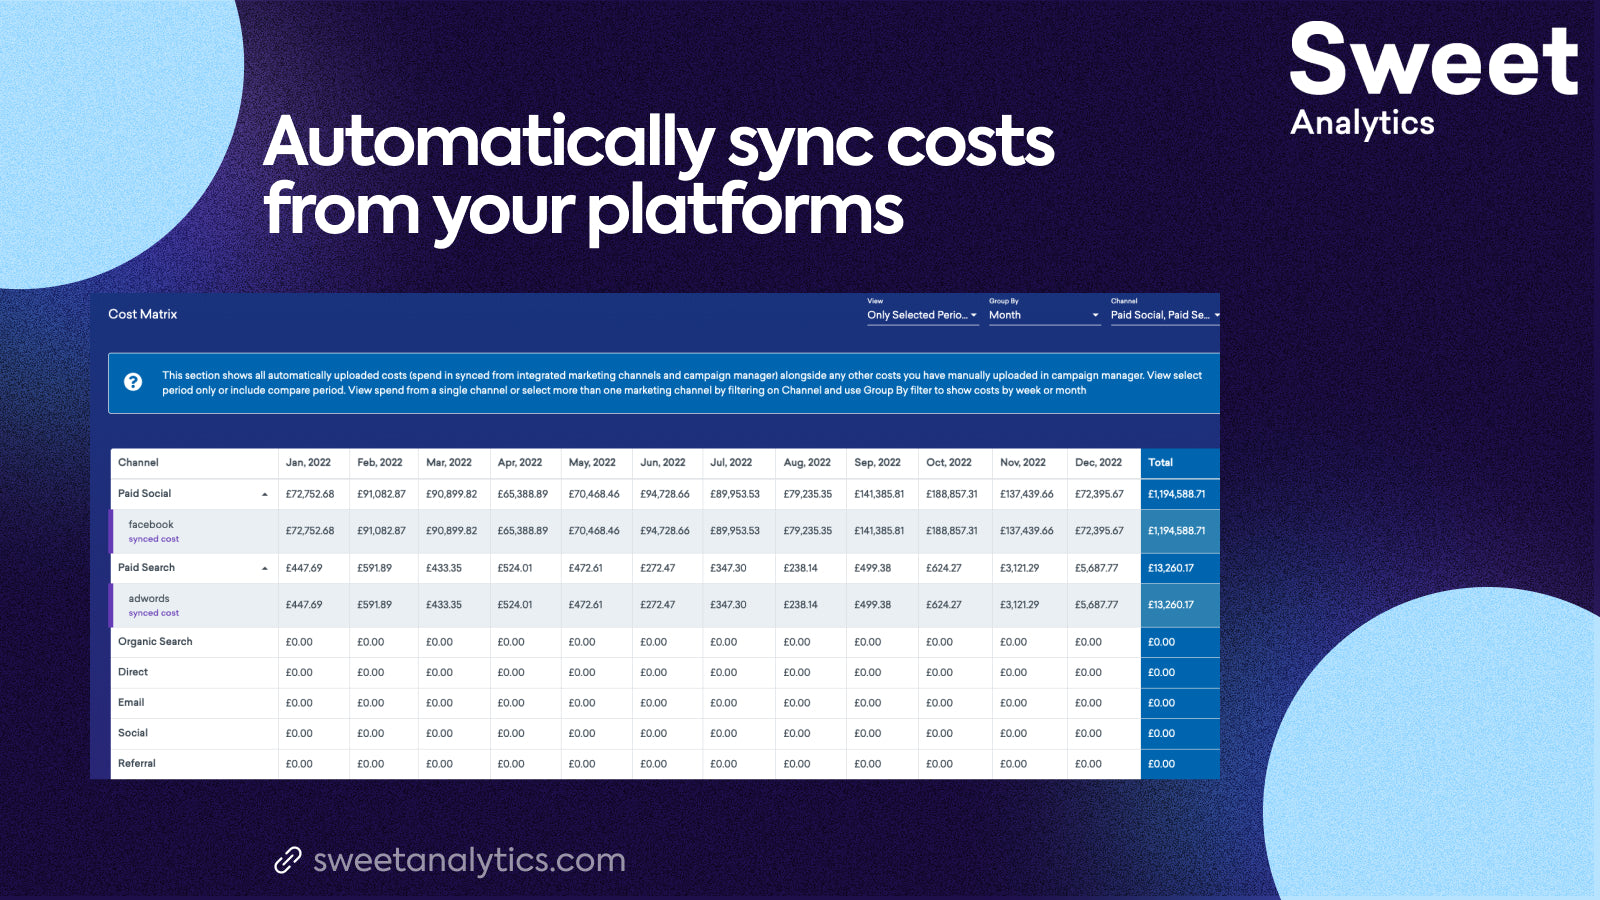
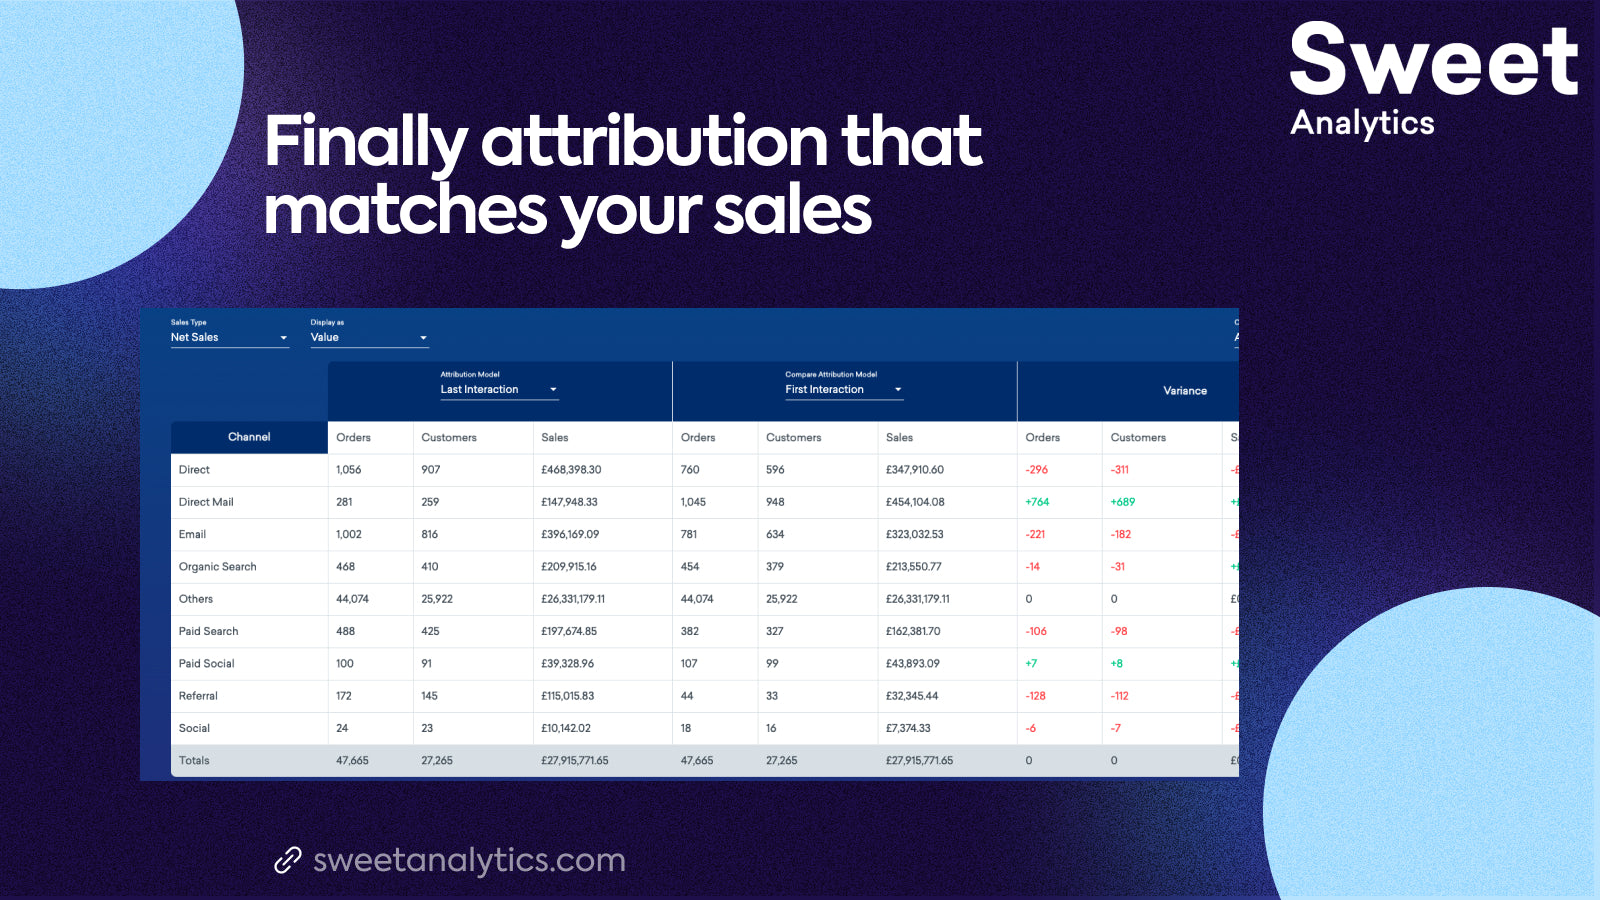
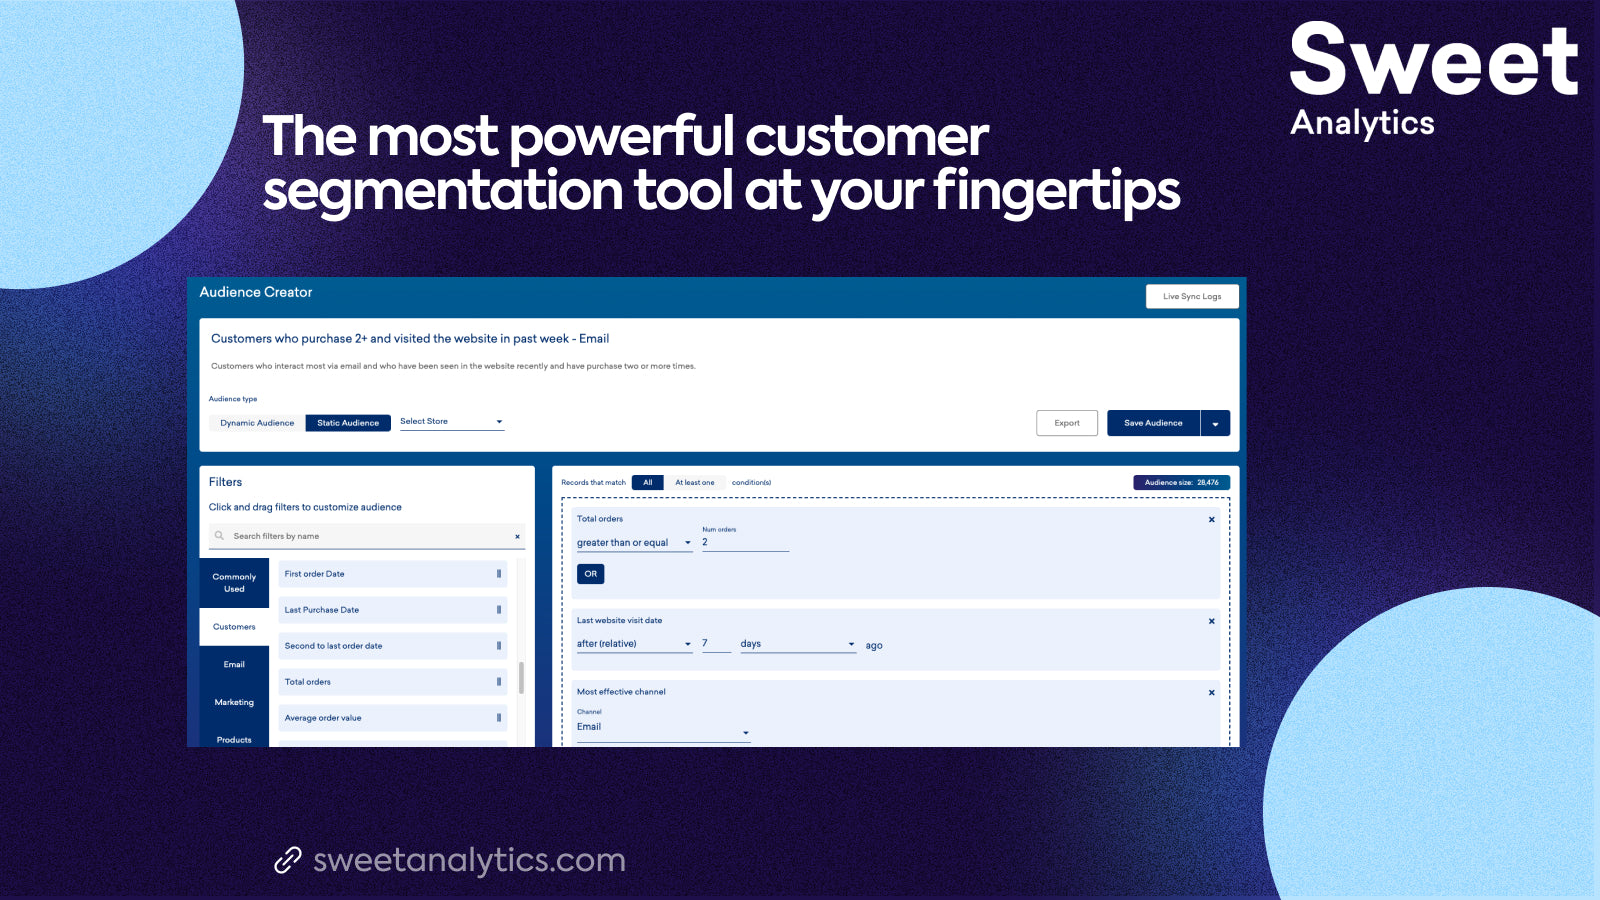
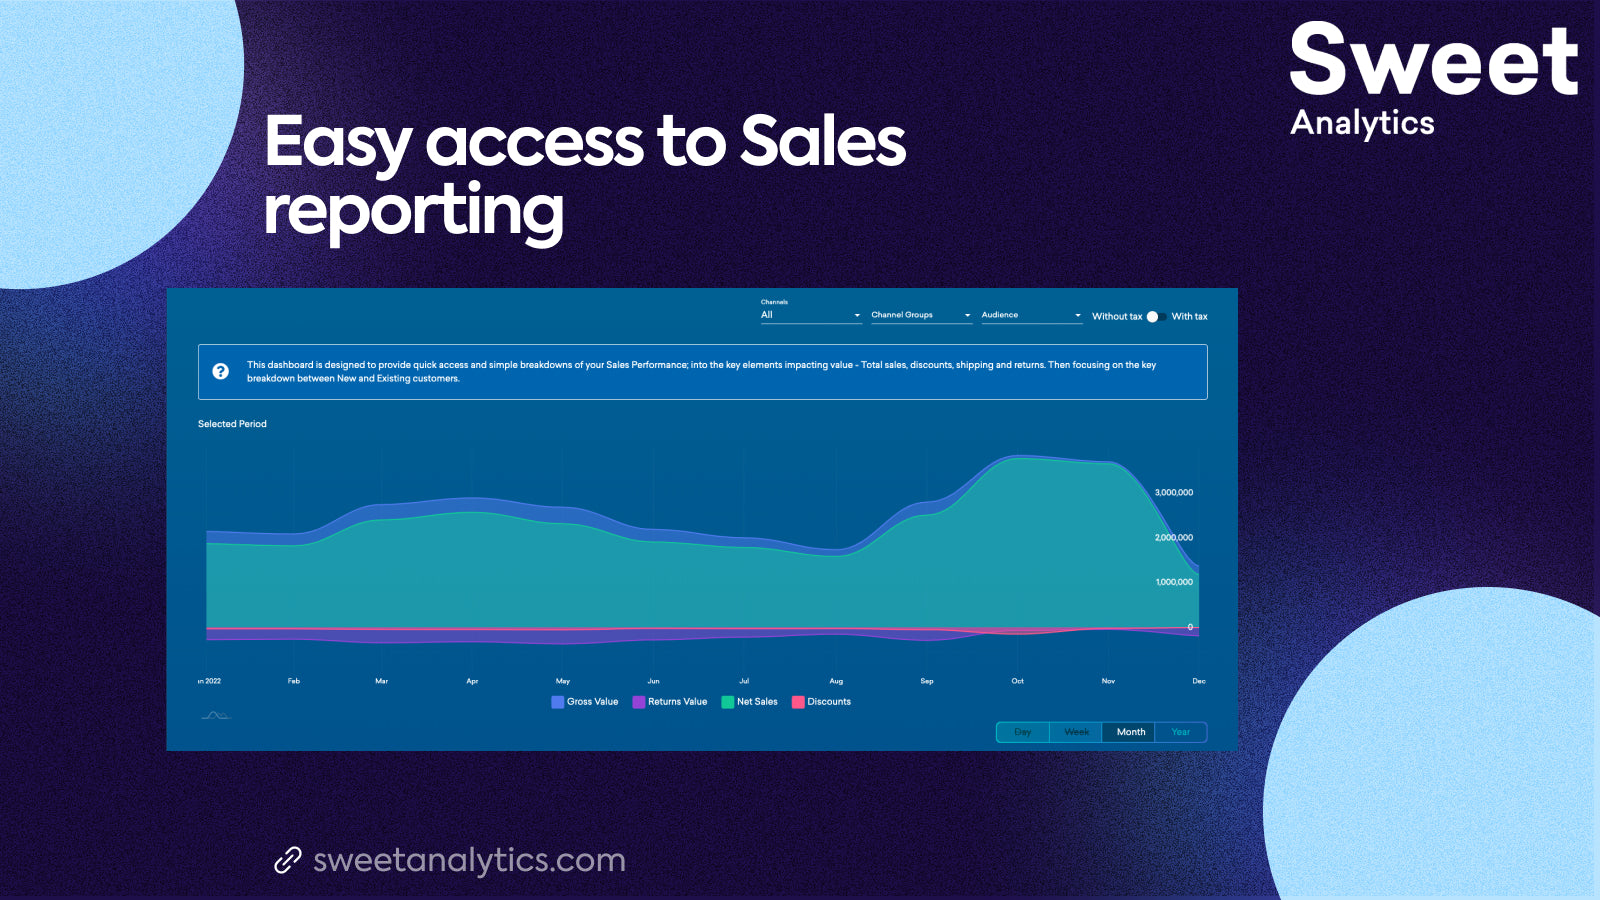
Sweet Analytics is built for retailers by retailers. We can help you deliver an improved ROI on marketing spend. Our retail analytics tool delivers insights & actions and will help you answer these key questions: - What is driving your sales? - Which of your… Sweet Analytics is built for retailers by retailers. We can help you deliver an improved ROI on marketing spend. Our retail analytics tool delivers insights & actions and will help you answer these key questions: - What is driving your sales? - Which of your marketing channels are most effective? - How many customers do you need to acquire to retain? Our eCommerce analytics app provides benefits such as: - Saving time reporting - Improving marketing ROI - Improving the chance of hitting targets
Works with 6 apps and tools
Sweet Analytics and Reporting listing facts
- Developer
- Sweet Analytics
- Launched
- August 25, 2022
- Shopify rank
- #109 in Analytics#286 in Operations
- Languages
- English
Shopify stores using Sweet Analytics and Reporting
Shoplist is watching Shopify storefronts for the first public install of Sweet Analytics and Reporting.
How Sweet Analytics and Reporting’s install base is moving
Shoplist re-crawls the same storefronts, so every store that adds Sweet Analytics and Reporting, comes back to it or removes it shows up here. The store count also grows when Shoplist finds stores already running it; the breakdown keeps those apart from real installs.
Stores, last 28 days
0
0 now · 0 28 days earlier
Reach
0%
of the stores Shoplist tracks
Big-brand share
Not enough data: fewer than 150 of its stores have a known size
Where Sweet Analytics and Reporting’s store count change came from
- Real installs and removalsEstimated0 added · 0 came back · 0 removed
- 0
Stores adding and removing Sweet Analytics and Reporting, by week
| Week of | Added or back | Removed | Net | Notes |
|---|---|---|---|---|
| Aug 31, 2026 | 0 | 0 | 0 | Estimated |
| Sep 7, 2026 | 0 | 0 | 0 | Estimated |
| Sep 14, 2026 | 0 | 0 | 0 | Estimated |
| Sep 21, 2026 | 0 | 0 | 0 | Estimated |
| Sep 28, 2026 | 0 | 0 | 0 | Estimated |
| Oct 5, 2026 | 0 | 0 | 0 | Estimated |
| Oct 12, 2026 | 0 | 0 | 0 | Estimated |
| Oct 19, 2026 | 0 | 0 | 0 | Estimated |
| Oct 26, 2026 | 0 | 0 | 0 | Estimated |
| Nov 2, 2026 | 0 | 0 | 0 | 2 held-out days |
| Nov 9, 2026 | 0 | 0 | 0 | 1 held-out day |
Sweet Analytics and Reporting reach, by day
Show the daily numbers
- Oct 30, 2026: 0% of tracked stores
- Oct 31, 2026: 0% of tracked stores
- Nov 1, 2026: 0% of tracked stores
- Nov 2, 2026: 0% of tracked stores
- Nov 3, 2026: 0% of tracked stores
- Nov 4, 2026: 0% of tracked stores
- Nov 5, 2026: 0% of tracked stores
- Nov 6, 2026: 0% of tracked stores
- Nov 7, 2026: 0% of tracked stores
- Nov 8, 2026: 0% of tracked stores
- Nov 9, 2026: 0% of tracked stores
- Nov 10, 2026: 0% of tracked stores
- Nov 11, 2026: 0% of tracked stores
- Nov 12, 2026: 0% of tracked stores
- Nov 13, 2026: 0% of tracked stores
- Nov 14, 2026: 0% of tracked stores
- Nov 15, 2026: 0% of tracked stores
- Nov 16, 2026: 0% of tracked stores
- Nov 17, 2026: 0% of tracked stores
- Nov 18, 2026: 0% of tracked stores
- Nov 19, 2026: 0% of tracked stores
Stores running Sweet Analytics and Reporting over the stores Shoplist crawled in the 30 days before. Counted daily from Oct 30, 2026.
Compare Sweet Analytics and Reporting
The apps in its App Store category, with the stores Shoplist detects on each and their listing ratings.
Alternatives to Sweet Analytics and Reporting
Apps merchants weigh against Sweet Analytics and Reporting, with their own detected stores and ratings.
Sweet Analytics and Reporting vs Polar:AI Platform for commerce
Sweet Analytics and Reporting vs Juicy Profit Analytics
Sweet Analytics and Reporting vs Daasity Reporting & Analytics
Sweet Analytics and Reporting vs Bloom Profit Analytics
Sweet Analytics and Reporting vs Growify
Sweet Analytics and Reporting vs Kleio Analytics


Follow the apps you compete with and decide which changes deserve action. See the competitor-monitoring workflow.
Seen on the storefront, not guessed
If Shoplist shows Sweet Analytics and Reporting on a store, it’s there. Every count on this page traces to code found on a live storefront, re-checked on every crawl.
Code-level
Found in the storefront’s own code
Shoplist matches the scripts, app blocks and pixels Sweet Analytics and Reporting loads on each live storefront. No surveys, no developer-reported numbers, no model guessing installs from review counts.
Re-checked, so the count stays current
Shoplist keeps crawling the same storefronts. A store that uninstalls Sweet Analytics and Reporting leaves the count on the next crawl, so you read today’s install base, not a high-water mark.
Daily
The App Store, read every day
Rank, reviews, pricing and every listing edit are captured daily, so a price change or a ranking slip shows up here the day it ships.
Two public sources, labelled on every section. Store data last checked .
Read the full methodologyQuestions about Sweet Analytics and Reporting
Straight answers from the same data as the rest of this page. The full store list answers the rest.
Why might Shoplist not show detected stores for Sweet Analytics and Reporting?
Some Shopify apps are admin-only, server-side, theme-independent, or otherwise difficult to detect from public storefront signals.
Does no public detection mean Sweet Analytics and Reporting has no users?
No. It only means Shoplist has not found reliable public storefront evidence for Sweet Analytics and Reporting. reviews, pricing, listing changes, and developer data can still be useful signals.
Can I monitor future public detections?
Yes. Shoplist can monitor Sweet Analytics and Reporting for future public storefront detections and listing movement.
Go beyond Sweet Analytics and Reporting
Its closest rival, its developer and the charts it competes on, from the same data.
- Sweet Analytics and Reporting vs PolarDetected stores, store movement, ratings and pricing side by side.
- Sweet AnalyticsEvery app Sweet Analytics publishes, with their detected reach.
- Top apps by categoryThe ten apps gaining the most detected installs in each category.
- All Shopify appsBrowse every app Shoplist tracks, by category, rating, and reach.
Keep watching Sweet Analytics and Reporting.
Get alerted on first storefront installs, review spikes, pricing changes, and listing edits.
