

TillClose: End of Day Report vs Cleartill
Two Shopify apps, side by side: detected stores, momentum, reviews, plans, listed features and who runs each. Store counts as of Oct 14, 2026.
The short answer
- Only Cleartill lists a free plan. Paid plans start at $19/month for TillClose and $29/month for Cleartill.
- Cleartill lists 3 features TillClose’s listing doesn’t mention, including AI insights, Analytics dashboard, Profit insights.
Head to head


Standard
- · PDF closeouts for the latest 60 days
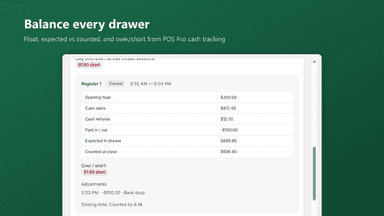
- · POS Pro drawer over/short
- · Read-only, no report builder
- · Sales, taxes, refunds and tender totals
Retail Pro
- · Automated 9 PM nightly email report
- · Up to 3 store locations
Enterprise
- · Staff POS attribution and audit exports
- · Unlimited locations and registers
Free
- · 30 days of history
- · AI product cost estimates
- · Monthly profit summary email
- · Profit dashboard and waterfall
- · Up to 100 orders in any 30 days
Lite
- · Daily profit email, 60 days of history
- · Everything in Free
- · Full product ranking by name
- · Up to 500 orders in any 30 days
Pro
- · Daily profit email, 60 days of history
- · Everything in Free
- · Full product ranking by name
- · Up to 3,000 orders in any 30 days
Max
- · Daily profit email, 60 days of history
- · Everything in Free
- · Full product ranking by name
- · Up to 10,000 orders in any 30 days
Coverage counts what each App Store listing names. Every feature, checked off app by app, is in Shoplist.
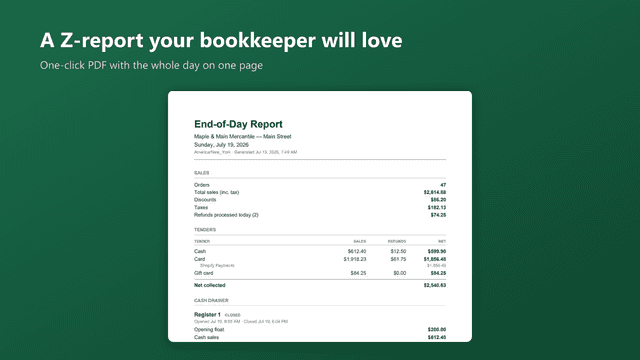
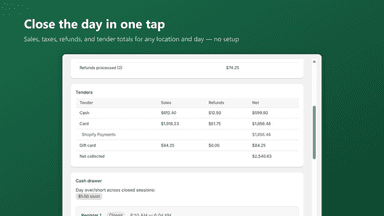
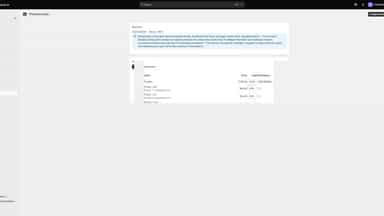
See every featureTillClose creates one bookkeeper-ready end-of-day report for each Shopify POS location. Open the POS tile to combine daily sales, discounts, taxes, refunds, payment methods, and POS Pro cash drawer reconciliation, then print or download a familiar Z report PDF. Review any location and day from the latest 60 days in Shopify Admin. Sales and payment totals work with POS Lite; drawer over or short requires POS Pro.
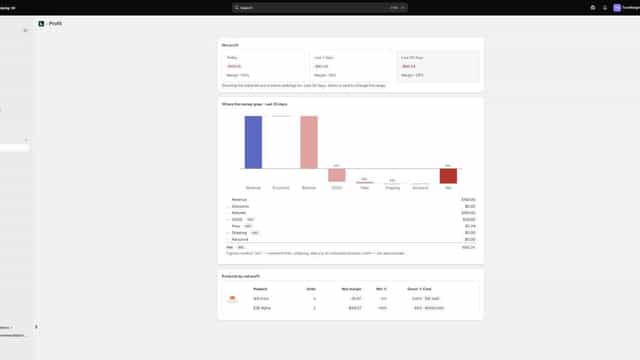
Cleartill calculates your store's profit after tracked costs by subtracting cost of goods sold, payment-processing fees, shipping, and ad spend from your Shopify sales. Overheads such as rent and salaries are not tracked, and the app says so. A waterfall shows where the money goes, and a per-product breakdown shows which products make money.
- One-tap daily closeout for any location and day. No report builder to set up.
- Tender breakdown from real transactions: cash, card, gift card, net collected.
- Drawer reconciliation with POS Pro cash tracking: float, expected, over/short.
- Net profit after COGS, payment fees, shipping, and ad spend
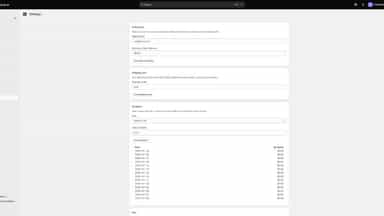
- AI estimates missing product costs, clearly labeled and editable
- Per-product margins that reconcile to your shop total
- A daily profit email with yesterday's net profit and margin
All the numbers
Every figure, side by side
A green dot marks the app ahead on a measured figure. Estimates, gaps and apps that leave no storefront trace never take the lead.
Adoption
| Measure |  TillClose |  Cleartill |
|---|---|---|
| Detected stores | Not published | Not published |
| Net store change, 28 days | 0 | 0 |
| Stores added, 28 days | Not enough data | Not enough data |
| Big-brand share | Not enough data | Not enough data |
| Top store categories | Not published | Not published |
| Top store countries | Not published | Not published |
Reviews
| Measure | TillClose | Cleartill |
|---|---|---|
| App Store rating | Not published | Not published |
| App Store reviews | Not published | Not published |
| New reviews, 28 days | Not enough data | Not enough data |
| Reviewers a year or more in | Not enough data | Not enough data |
FAQ
TillClose and Cleartill: common questions
- Is TillClose or Cleartill cheaper?
- Only Cleartill lists a free plan. Paid plans start at $19/month for TillClose and $29/month for Cleartill. Shoplist compares base prices only between monthly plans in the same currency; usage charges and annual plans vary, so check each plan’s limits.
- What features does each app list that the other doesn’t?
- TillClose lists 1 the others don’t mention, such as Custom reports. Cleartill lists 3 the others don’t mention, such as AI insights, Analytics dashboard, Profit insights. A feature missing from a listing may still be supported; this compares what each App Store listing says.
- Where does this comparison’s data come from?
- Shoplist crawls Shopify storefronts to detect which apps each store runs, and reads each app’s Shopify App Store listing for reviews, pricing, features and integrations. Store counts are as of Oct 14, 2026; estimated figures are labeled.
How Shoplist compares apps
Store counts come from Shoplist’s crawl of Shopify storefronts, which detects the apps each store runs; they are as of Oct 14, 2026. Reviews, ratings, plans, features and integrations come from each app’s Shopify App Store listing. 28-day figures are labeled when estimated, and a figure that is missing or estimated never decides who leads. Read the methodology.