

Technis: Foot Traffic Counter vs Traqi
Two Shopify apps, side by side: detected stores, momentum, reviews, plans, listed features and who runs each. Store counts as of Oct 23, 2026 for Technis, Nov 8, 2026 for Traqi.
The short answer
- Traqi lists 8 features Technis’s listing doesn’t mention, including Custom dashboards, Data export, Marketing attribution.
Head to head


- India
Essential
- · Sensor deposit: $350/sensor, refundable
- · Sensor license: $28 per sensor per month
Coverage counts what each App Store listing names. Every feature, checked off app by app, is in Shoplist.
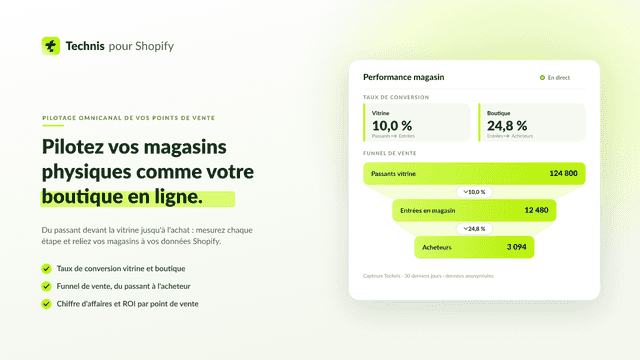
See every featureTechnis counts the people entering your stores and compares that traffic with your Shopify POS sales. You get the metrics you already track online: visitors, conversion rate, average order value, and revenue per visitor for every store. Compare locations side by side, spot peak hours to plan staffing, and follow your funnel from passer-by to purchase.
Traqi gives e-commerce brands and the agencies that run them one place to measure performance across every channel they spend on. Connect your store and marketing tools once, and Traqi pulls daily metrics — orders, revenue, ad spend, sessions, email engagement — into a unified dashboard with consistent definitions, currency, and date ranges.
- Comptez les visiteurs en magasin et obtenez votre conversion réelle
- Synchronisez vos ventes Shopify POS avec le trafic de vos magasins
- Suivez panier moyen et CA par visiteur, par magasin et par heure
- Analysez une démographie anonymisée, sans reconnaissance faciale
- Unified dashboard, revenue, spend, ROAS, AOV, conversion rate all in one view
- Attribution & blended ROAS see how channels work together, not just last-click
- Multi-brand workspace, manage unlimited stores from one account (ideal for age


All the numbers
Every figure, side by side
A green dot marks the app ahead on a measured figure. Estimates, gaps and apps that leave no storefront trace never take the lead.
Adoption
| Measure |  Technis |  Traqi |
|---|---|---|
| Detected stores | Not published | 12 |
| Net store change, 28 days | 0 | 0 |
| Stores added, 28 days | Not enough data | Not enough data |
| Big-brand share | Not enough data | Not enough data |
| Top store categories | Not published | Apparel & Accessories, Health & Beauty, Food, Beverages & Tobacco |
| Top store countries | Not published | India |
Reviews
| Measure | Technis | Traqi |
|---|---|---|
| App Store rating | Not published | Not published |
| App Store reviews | Not published | Not published |
| New reviews, 28 days | Not enough data | Not enough data |
| Reviewers a year or more in | Not enough data | Not enough data |
FAQ
Technis and Traqi: common questions
- What features does each app list that the other doesn’t?
- Technis lists 5 the others don’t mention, such as Benchmarking, Cohort analysis, Event tracking, Heatmaps. Traqi lists 8 the others don’t mention, such as Custom dashboards, Data export, Marketing attribution, Page views. A feature missing from a listing may still be supported; this compares what each App Store listing says.
- Where does this comparison’s data come from?
- Shoplist crawls Shopify storefronts to detect which apps each store runs, and reads each app’s Shopify App Store listing for reviews, pricing, features and integrations. Store counts are as of Oct 23, 2026 for Technis, Nov 8, 2026 for Traqi; estimated figures are labeled.
How Shoplist compares apps
Store counts come from Shoplist’s crawl of Shopify storefronts, which detects the apps each store runs; they are as of Oct 23, 2026 for Technis, Nov 8, 2026 for Traqi. Reviews, ratings, plans, features and integrations come from each app’s Shopify App Store listing. 28-day figures are labeled when estimated, and a figure that is missing or estimated never decides who leads. Read the methodology.