

SnapMetrics vs Synder Insights‑sales reports
Two Shopify apps, side by side: detected stores, momentum, reviews, plans, listed features and who runs each. Store counts as of Oct 14, 2026 for SnapMetrics, Oct 13, 2026 for Synder Insights‑sales reports.
The short answer
Head to head


Momentum
New reviews each month
Review pace is the clearest public read on how fast an app is winning new merchants.
Free
Professional
- · Cross-platform e-com KPIs
- · Customer cohort reports
- · Hourly data imports
- · Product analytics
- · Sales analytics
- · Up to 1000 orders/mo
Growth
- · Cross-platform e-com KPIs
- · Customer cohort reports
- · Hourly data imports
- · Product and COGS analytics
- · Sales analytics
- · Up to 10,000 orders/mo
Coverage counts what each App Store listing names. Every feature, checked off app by app, is in Shoplist.
See every featureYou spend a lot of money to acquire customers. Every decision you make either costs or makes money. We help you make smarter decisions to grow your online business.
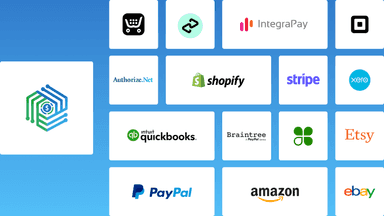
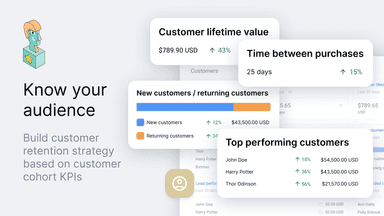
Start growing your business with Synder Insights. The tool provides analytics and reports based on the raw data coming from all your connected platforms. It easily connects to your stores as well as their payment gateways.
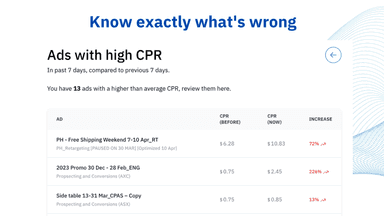
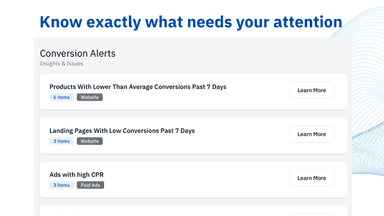
- Automatic insights and alerts
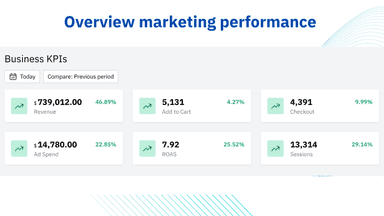
- Overview your marketing performance
- Weekly email updates
- Seamless connection with 25+ integrations
- Hourly data update for quick data driven decision making
- 40+ KPIs and metrics to grow your business
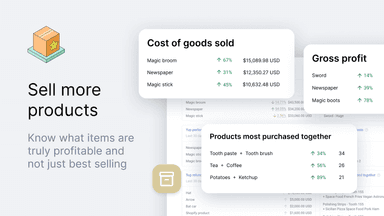
- COGS and product profitability tracking


All the numbers
Every figure, side by side
A green dot marks the app ahead on a measured figure. Estimates, gaps and apps that leave no storefront trace never take the lead.
Adoption
| Measure |  SnapMetrics |  Synder Insights‑sales reports |
|---|---|---|
| Detected stores | Not published | Not published |
| Net store change, 28 days | 0 | 0 |
| Stores added, 28 days | Not enough data | Not enough data |
| Big-brand share | Not enough data | Not enough data |
| Top store categories | Not published | Not published |
| Top store countries | Not published | Not published |
Reviews
| Measure | SnapMetrics | Synder Insights‑sales reports |
|---|---|---|
| App Store rating | 5.0 ★ | Not published |
| App Store reviews | 2 | Not published |
| New reviews, 28 days | 0 | Not enough data |
| Reviewers a year or more in | Not enough data | Not enough data |
Pricing
| Measure | SnapMetrics | Synder Insights‑sales reports |
|---|---|---|
| Free plan | Not listed | Not listed |
| Lowest paid monthly plan | No monthly plan listed | $99/month |
| Longest free trial | Not listed | 15 days |
| Plans listed | 1 | 2 |
Listing
| Measure | SnapMetrics | Synder Insights‑sales reports |
|---|---|---|
| Shopify category rank | #931(ahead) | #1099 |
| Shopify App Charts | Not on this week’s charts | Not on this week’s charts |
| Built for Shopify | No | No |
| Launched | Aug 29, 2022 | Mar 27, 2023 |
| Languages | 1 | 1 |
| Developer | WebMedic | CloudBusiness Inc |
FAQ
SnapMetrics and Synder Insights‑sales reports: common questions
- Where does this comparison’s data come from?
- Shoplist crawls Shopify storefronts to detect which apps each store runs, and reads each app’s Shopify App Store listing for reviews, pricing, features and integrations. Store counts are as of Oct 14, 2026 for SnapMetrics, Oct 13, 2026 for Synder Insights‑sales reports; estimated figures are labeled.
How Shoplist compares apps
Store counts come from Shoplist’s crawl of Shopify storefronts, which detects the apps each store runs; they are as of Oct 14, 2026 for SnapMetrics, Oct 13, 2026 for Synder Insights‑sales reports. Reviews, ratings, plans, features and integrations come from each app’s Shopify App Store listing. 28-day figures are labeled when estimated, and a figure that is missing or estimated never decides who leads. Read the methodology.