

Sense UTM Analytics vs SigmaSense COD Profit Analysis
Two Shopify apps, side by side: detected stores, momentum, reviews, plans, listed features and who runs each. Store counts as of Oct 23, 2026 for Sense UTM Analytics, Oct 14, 2026 for SigmaSense COD Profit Analysis.
The short answer
- Both list a free plan. Paid plans start at $3.95/month for Sense UTM Analytics and $8.99/month for SigmaSense COD Profit Analysis.
- Sense UTM Analytics lists 9 features SigmaSense COD Profit Analysis’s listing doesn’t mention, including Activity tracking, Checkout analytics, Custom reports.
Head to head


Momentum
New reviews each month
Review pace is the clearest public read on how fast an app is winning new merchants.
Free
- · Analytics & Statistics
- · Date filter
- · UTM link generator
- · UTM tracking
- · Up to 30 orders/month
Standard
- · Analytics & Statistics
- · Date filter
- · UTM link generator
- · UTM tracking
- · Up to 150 orders/month
Pro
- · Analytics & Statistics
- · Date filter
- · UTM link generator
- · UTM tracking
- · Up to 500 orders/month
Premium
- · Analytics & Statistics
- · Date filter
- · UTM link generator
- · UTM tracking
- · Unlimited orders
Free
- · Dashboard overview
- · Expense tracking
- · Orders & customer insights
- · SKU cost tracking
- · Up to 200 orders per billing cycle
Growth
- · Basic profitability analytics
- · City insights (Top 3)
- · Courier performance reports
- · Product performance (Top 3)
- · Up to 1,500 orders per billing cycle
Pro
- · Address review intelligence
- · Advanced profitability analytics
- · Customer risk detection
- · Full action center alerts
- · Up to 10,000 orders per billing cycle
Elite
- · Best for high-volume Shopify stores
- · Everything in Pro
- · Priority processing
- · Up to 50,000 orders per billing cycle
Coverage counts what each App Store listing names. Every feature, checked off app by app, is in Shoplist.
See every featureSense UTM Analytics allows you to view statistics for your distribution of orders into campaigns. As you may know, ever since the release of iOS14, conversion reports have become a mess and less accurate, with delayed reporting of up to several days. Our app changes the game's rules: you can view your Shopify orders in close to real-time along with the UTM conversion analytics.
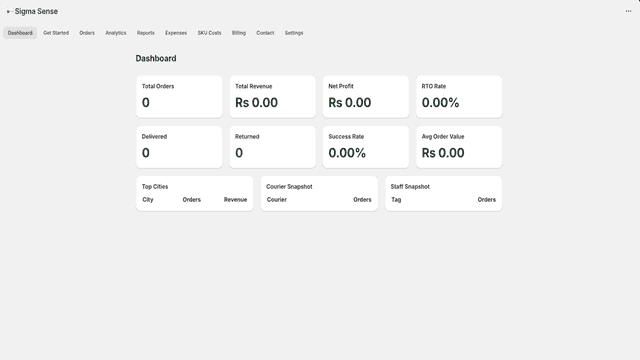
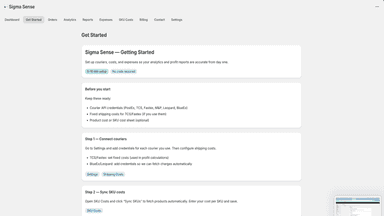
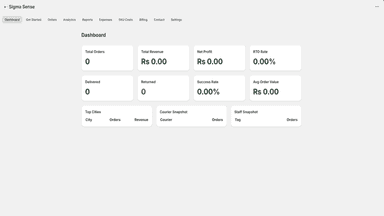
SigmaSense helps Shopify merchants track real profit, COD flow, courier performance, returns, and order trends in one dashboard. It is especially useful for stores that need clearer visibility into cash flow, delivery performance, and operational bottlenecks. Merchants can monitor profit, return patterns, courier efficiency, and order activity without relying on manual spreadsheets.
- Live and instant insights of your UTM conversions.
- Visual graphs and statistics based on orders.
- Easy and fast UTM link generation.
- View orders, returns, and delivery data in a single analytics dashboard.
- Analyze courier performance including delivery success and return rates
- Track costs and profitability to understand true business performance
- Identify trends and issues early using clear visual reports



All the numbers
Every figure, side by side
A green dot marks the app ahead on a measured figure. Estimates, gaps and apps that leave no storefront trace never take the lead.
Adoption
| Measure |  Sense UTM Analytics |  SigmaSense COD Profit Analysis |
|---|---|---|
| Detected stores | Not published | Not published |
| Net store change, 28 days | 0 | 0 |
| Stores added, 28 days | Not enough data | Not enough data |
| Big-brand share | Not enough data | Not enough data |
| Top store categories | Not published | Not published |
| Top store countries | Not published | Not published |
Reviews
| Measure | Sense UTM Analytics | SigmaSense COD Profit Analysis |
|---|---|---|
| App Store rating | 4.0 ★ | Not published |
| App Store reviews | 18 | Not published |
| New reviews, 28 days | 0 | Not enough data |
| Reviewers a year or more in | Not enough data | Not enough data |
Pricing
| Measure | Sense UTM Analytics | SigmaSense COD Profit Analysis |
|---|---|---|
| Free plan | Yes | Yes |
| Lowest paid monthly plan | $3.95/month(ahead) | $8.99/month |
| Longest free trial | Not listed | 3 days |
| Plans listed | 4 | 4 |
Listing
| Measure | Sense UTM Analytics | SigmaSense COD Profit Analysis |
|---|---|---|
| Shopify category rank | #412(ahead) | #1254 |
| Shopify App Charts | Not on this week’s charts | Not on this week’s charts |
| Built for Shopify | No | No |
| Launched | Dec 28, 2022 | Mar 3, 2026 |
| Languages | 1 | 1 |
| Developer | Sense Apps | Sigma E-commerce Hub Pvt Ltd |
FAQ
Sense UTM Analytics and SigmaSense COD Profit Analysis: common questions
- Is Sense UTM Analytics or SigmaSense COD Profit Analysis cheaper?
- Both list a free plan. Paid plans start at $3.95/month for Sense UTM Analytics and $8.99/month for SigmaSense COD Profit Analysis. Shoplist compares base prices only between monthly plans in the same currency; usage charges and annual plans vary, so check each plan’s limits.
- What features does each app list that the other doesn’t?
- Sense UTM Analytics lists 9 the others don’t mention, such as Activity tracking, Checkout analytics, Custom reports, Data export. SigmaSense COD Profit Analysis lists 4 the others don’t mention, such as Cohort analysis, Funnel analysis, Profit insights, Segmentation. A feature missing from a listing may still be supported; this compares what each App Store listing says.
- Where does this comparison’s data come from?
- Shoplist crawls Shopify storefronts to detect which apps each store runs, and reads each app’s Shopify App Store listing for reviews, pricing, features and integrations. Store counts are as of Oct 23, 2026 for Sense UTM Analytics, Oct 14, 2026 for SigmaSense COD Profit Analysis; estimated figures are labeled.
How Shoplist compares apps
Store counts come from Shoplist’s crawl of Shopify storefronts, which detects the apps each store runs; they are as of Oct 23, 2026 for Sense UTM Analytics, Oct 14, 2026 for SigmaSense COD Profit Analysis. Reviews, ratings, plans, features and integrations come from each app’s Shopify App Store listing. 28-day figures are labeled when estimated, and a figure that is missing or estimated never decides who leads. Read the methodology.