

Seam AI Analytics vs Sillages: Social Gallery
Two Shopify apps, side by side: detected stores, momentum, reviews, plans, listed features and who runs each. Store counts as of Oct 13, 2026.
The short answer
- Only Seam AI Analytics lists a free plan. Paid plans start at $6/month for Seam AI Analytics and $9.99/month for Sillages.
- Seam AI Analytics lists 10 features Sillages’s listing doesn’t mention, including Activity tracking, Checkout analytics, Custom dashboards.
Head to head


Momentum
New reviews each month
Review pace is the clearest public read on how fast an app is winning new merchants.
Free
- · Daily Insight Emails
- · Feed with seam history
- · Shareable insight images
- · Standard AI model
Pro
- · Advanced AI Models
- · Daily Insight Emails
- · Deeper Analysis
- · Priority support
- · Team Accounts
- · Tone of voice customization
Basic
- · Automatic catalog sync
- · Essential interaction metrics
- · One social gallery
- · Save and share
- · Shoppable product variants
- · Social Stories
Coverage counts what each App Store listing names. Every feature, checked off app by app, is in Shoplist.
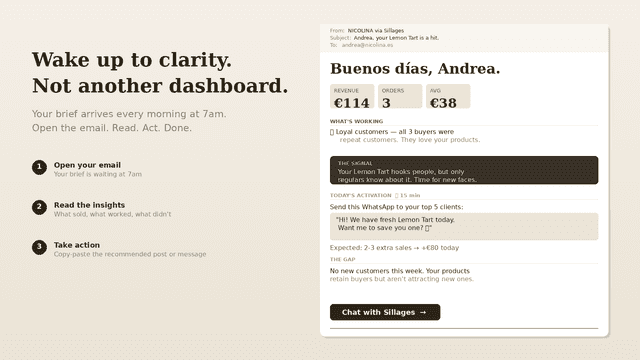
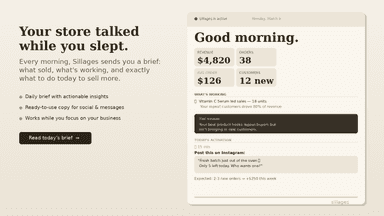
See every featureMost analytics apps give you another dashboard to check. Seam goes the other way. Every day, it analyzes your last 24 hours of orders, customers, products, and traffic, finds the one change worth knowing about, and emails it to you in plain language at the time you choose. There is no setup, no configuration, and no reports to build.
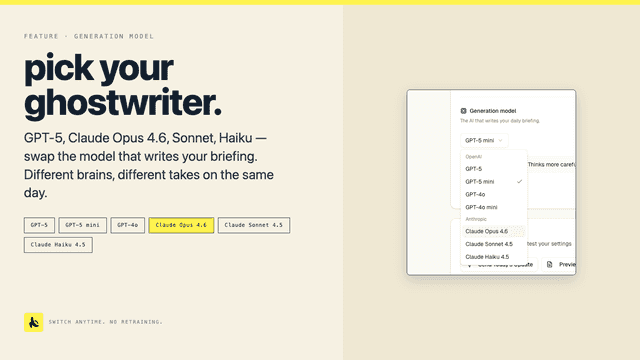
Make your store catalog feel like the content customers already enjoy browsing. Sillages turns your existing product images into social-style, shoppable galleries and Stories, with no theme code changes and no manual updates. Choose a collection, pick a visual style and publish. Images, prices, variants and inventory stay synchronized whenever your catalog changes.
- Analyzes orders, customers, products, and traffic to find patterns you might mis
- Delivers a concise, actionable summary to your inbox daily
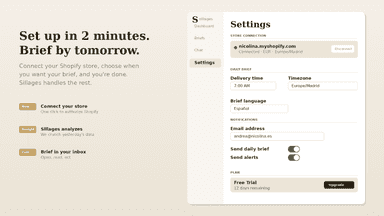
- No setup or configuration required
- Daily morning brief delivered to your inbox
- Top product and sales performance analysis
- Actionable recommendation with ready-to-use copy
- Repeat vs new customer pattern detection



All the numbers
Every figure, side by side
A green dot marks the app ahead on a measured figure. Estimates, gaps and apps that leave no storefront trace never take the lead.
Adoption
| Measure |  Seam AI Analytics |  Sillages |
|---|---|---|
| Detected stores | Not published | Not published |
| Net store change, 28 days | 0 | 0 |
| Stores added, 28 days | Not enough data | Not enough data |
| Big-brand share | Not enough data | Not enough data |
| Top store categories | Not published | Not published |
| Top store countries | Not published | Not published |
Reviews
| Measure | Seam AI Analytics | Sillages |
|---|---|---|
| App Store rating | 5.0 ★ | Not published |
| App Store reviews | 3 | Not published |
| New reviews, 28 days | Not enough data | Not enough data |
| Reviewers a year or more in | Not enough data | Not enough data |
Pricing
| Measure | Seam AI Analytics | Sillages |
|---|---|---|
| Free plan | Yes | Not listed |
| Lowest paid monthly plan | $6/month(ahead) | $9.99/month |
| Longest free trial | Not listed | 14 days |
| Plans listed | 2 | 1 |
Listing
| Measure | Seam AI Analytics | Sillages |
|---|---|---|
| Shopify category rank | #340(ahead) | #1303 |
| Shopify App Charts | Not on this week’s charts | Not on this week’s charts |
| Built for Shopify | No | No |
| Launched | May 5, 2026 | May 20, 2026 |
| Languages | 1 | 2 |
| Developer | Banana for Scale AS | Sillages |
FAQ
Seam AI Analytics and Sillages: common questions
- Is Seam AI Analytics or Sillages cheaper?
- Only Seam AI Analytics lists a free plan. Paid plans start at $6/month for Seam AI Analytics and $9.99/month for Sillages. Shoplist compares base prices only between monthly plans in the same currency; usage charges and annual plans vary, so check each plan’s limits.
- What features does each app list that the other doesn’t?
- Seam AI Analytics lists 10 the others don’t mention, such as Activity tracking, Checkout analytics, Custom dashboards, Custom reports. Sillages lists 7 the others don’t mention, such as Abandoned cart, AI insights, Event tracking, Lifetime value (LTV). A feature missing from a listing may still be supported; this compares what each App Store listing says.
- Where does this comparison’s data come from?
- Shoplist crawls Shopify storefronts to detect which apps each store runs, and reads each app’s Shopify App Store listing for reviews, pricing, features and integrations. Store counts are as of Oct 13, 2026; estimated figures are labeled.
How Shoplist compares apps
Store counts come from Shoplist’s crawl of Shopify storefronts, which detects the apps each store runs; they are as of Oct 13, 2026. Reviews, ratings, plans, features and integrations come from each app’s Shopify App Store listing. 28-day figures are labeled when estimated, and a figure that is missing or estimated never decides who leads. Read the methodology.