
ReturnRadar vs Skymetrics
Two Shopify apps, side by side: detected stores, momentum, reviews, plans, listed features and who runs each. Store counts as of Oct 14, 2026 for ReturnRadar, Nov 8, 2026 for Skymetrics.
The short answer
- Only ReturnRadar lists a free plan. Paid plans start at $9/month for ReturnRadar and $59/month for Skymetrics.
- Skymetrics lists 17 features ReturnRadar’s listing doesn’t mention, including Abandoned cart, Activity tracking, Benchmarking.
Head to head


- Spain
- Portugal
- United Arab Emirates
Momentum
New reviews each month
Review pace is the clearest public read on how fast an app is winning new merchants.
Free
- · Actionable recommendations
- · SKU-level analytics
- · Up to 100 orders per month
Growth
- · Actionable recommendations
- · SKU-level analytics
- · Trend detection
- · Up to 1,000 orders per month
Professional
- · AI classification
- · Actionable recommendations
- · Advanced visualizations
- · SKU-level analytics
- · Trend detection
- · Up to 10,000 orders per month
Enterprise
- · AI classification
- · Actionable recommendations
- · Advanced visualizations
- · SKU-level analytics
- · Trend detection
- · Up to 100,000 orders per month
Basic Plan
- · 250 AI messages per month
- · 5 team members included
- · Analysis by country / market
- · Complete analytics dashboard
- · Real-time performance tracking
- · Standard support (48h response)
Pro Plan
- · 15 team members included
- · 1500 AI messages per month
- · Analysis by country / market
- · Complete analytics dashboard
- · Priority support (24h response)
- · Real-time performance tracking
Enterprise Plan
- · Analysis by country / market
- · Complete analytics dashboard
- · Dedicated account manager
- · Early access to beta features
- · Priority support (24h response)
- · Real-time performance tracking
Coverage counts what each App Store listing names. Every feature, checked off app by app, is in Shoplist.
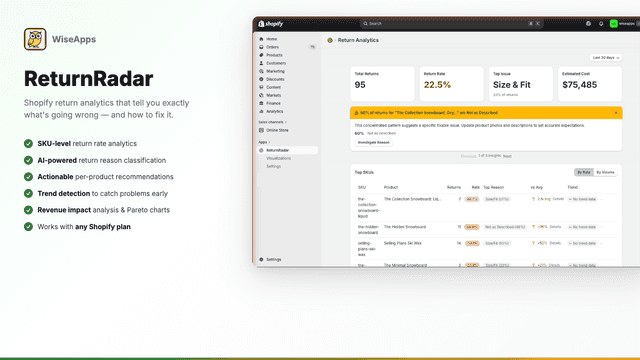
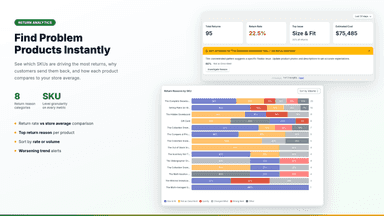
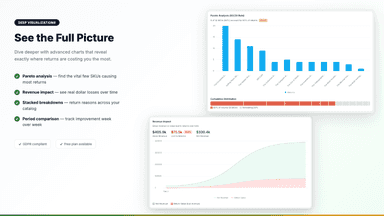
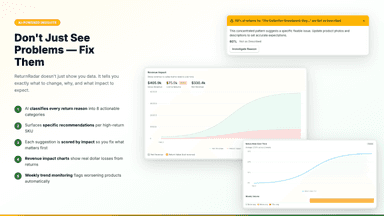
See every featureReturnRadar analyzes your Shopify returns to show why products get returned at the SKU level. The dashboard displays return rates, top issues, and estimated costs. AI classifies return reasons into actionable categories like Size and Fit, Quality, or Not as Described. For each problem product, you get specific recommendations based on actual return data. Trend monitoring flags SKUs with worsening return rates.
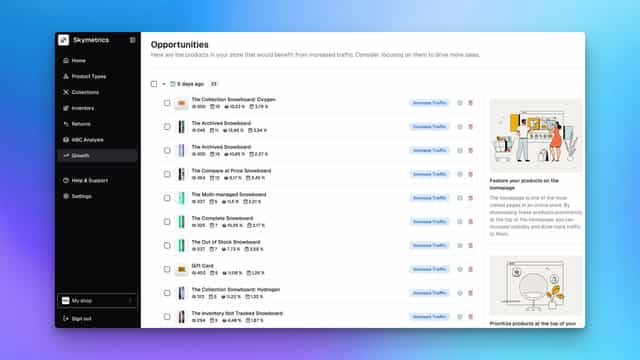
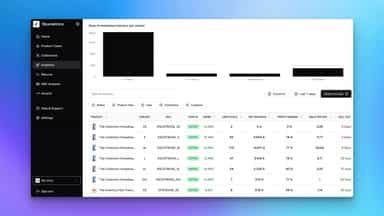
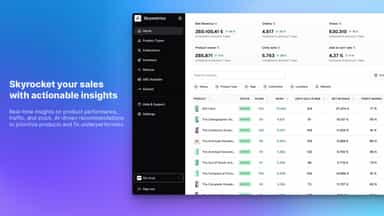
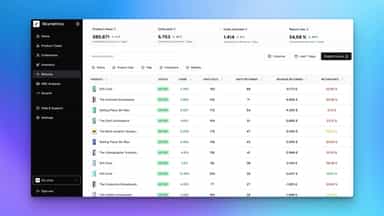
Skymetrics helps you make better decisions about every product in your store. Analyze sales, conversion, traffic, and inventory product by product to identify which ones drive revenue, which get visits without generating sales, and which may run out of stock. Get clear alerts and recommendations on what to promote, restock, optimize, or remove from your collections.
- SKU-level return rates with comparisons from your store data to find outliers
- AI classifies return reasons into actionable categories automatically
- Specific recommendations for each frequently returned product based on the data
- Trend monitoring flags products with worsening return rates over time
- Track conversion rates, traffic sources, and stock by product
- Predict stock depletion to prevent out-of-stock situations.
- AI-powered insights to prioritize top products and fix underperformers.
- Save time with instant, actionable recommendations for daily decisions.


All the numbers
Every figure, side by side
A green dot marks the app ahead on a measured figure. Estimates, gaps and apps that leave no storefront trace never take the lead.
Adoption
| Measure |  ReturnRadar |  Skymetrics |
|---|---|---|
| Detected stores | Not published | 20 |
| Net store change, 28 days | 0 | 0 |
| Stores added, 28 days | Not enough data | Not enough data |
| Big-brand share | Not enough data | Not enough data |
| Top store categories | Not published | Apparel & Accessories, Health & Beauty, Arts & Entertainment |
| Top store countries | Not published | Spain, Portugal, United Arab Emirates |
Reviews
| Measure | ReturnRadar | Skymetrics |
|---|---|---|
| App Store rating | Not published | 5.0 ★ |
| App Store reviews | Not published | 6 |
| New reviews, 28 days | Not enough data | Not enough data |
| Reviewers a year or more in | Not enough data | Not enough data |
Pricing
| Measure | ReturnRadar | Skymetrics |
|---|---|---|
| Free plan | Yes | Not listed |
| Lowest paid monthly plan | $9/month(ahead) | $59/month |
| Longest free trial | 14 days | 14 days |
| Plans listed | 4 | 3 |
Listing
| Measure | ReturnRadar | Skymetrics |
|---|---|---|
| Shopify category rank | #969 | #244(ahead) |
| Shopify App Charts | Not on this week’s charts | Not on this week’s charts |
| Built for Shopify | No | No |
| Launched | Apr 6, 2026 | Nov 6, 2024 |
| Languages | 1 | 1 |
| Developer | WiseApps | Skymetrics |
FAQ
ReturnRadar and Skymetrics: common questions
- Is ReturnRadar or Skymetrics cheaper?
- Only ReturnRadar lists a free plan. Paid plans start at $9/month for ReturnRadar and $59/month for Skymetrics. Shoplist compares base prices only between monthly plans in the same currency; usage charges and annual plans vary, so check each plan’s limits.
- What features does each app list that the other doesn’t?
- ReturnRadar lists 2 the others don’t mention, such as Cohort analysis, Historical analysis. Skymetrics lists 17 the others don’t mention, such as Abandoned cart, Activity tracking, Benchmarking, Checkout analytics. A feature missing from a listing may still be supported; this compares what each App Store listing says.
- Where does this comparison’s data come from?
- Shoplist crawls Shopify storefronts to detect which apps each store runs, and reads each app’s Shopify App Store listing for reviews, pricing, features and integrations. Store counts are as of Oct 14, 2026 for ReturnRadar, Nov 8, 2026 for Skymetrics; estimated figures are labeled.
How Shoplist compares apps
Store counts come from Shoplist’s crawl of Shopify storefronts, which detects the apps each store runs; they are as of Oct 14, 2026 for ReturnRadar, Nov 8, 2026 for Skymetrics. Reviews, ratings, plans, features and integrations come from each app’s Shopify App Store listing. 28-day figures are labeled when estimated, and a figure that is missing or estimated never decides who leads. Read the methodology.