
PriceCraft Pricing Graph vs Stakeout ‑ Price Monitoring
Two Shopify apps, side by side: detected stores, momentum, reviews, plans, listed features and who runs each. Store counts as of Oct 13, 2026.
The short answer
- Stakeout lists 3 features PriceCraft Pricing Graph’s listing doesn’t mention, including Custom reports, Profit insights, Report scheduling.
Head to head


PriceCraft Graph
- · Manual price control
- · Product importance ratings (stars)
- · Suggested next price
- · Unlimited product analysis
- · Visual price performance graph
Monitor
- · Configurable localized Amazon location
- · Configurable localized Google Shopping
- · Daily automated reports (timezone aware)
- · Track up to 5 products
Analyze
- · Configurable localized Amazon location
- · Configurable localized Google Shopping
- · Daily automated reports (timezone aware)
- · Historical Trends Graph
- · Track up to 25 products
Optimize
- · Configurable localized Amazon location
- · Configurable localized Google Shopping
- · Daily automated reports (timezone aware)
- · Historical Trends Graph
- · Track up to 50 products
Coverage counts what each App Store listing names. Every feature, checked off app by app, is in Shoplist.
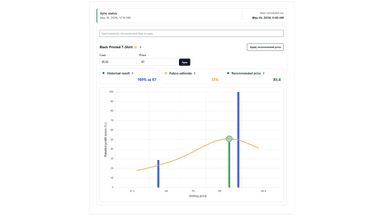
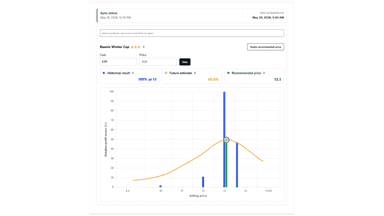
See every featurePriceCraft Pricing Graph helps you improve product pricing with insights from your store’s sales data. Review product price history, see how different prices performed, understand margin context, and get suggested prices before making changes. The visual graph makes pricing decisions easier, while you stay in control of every final price.
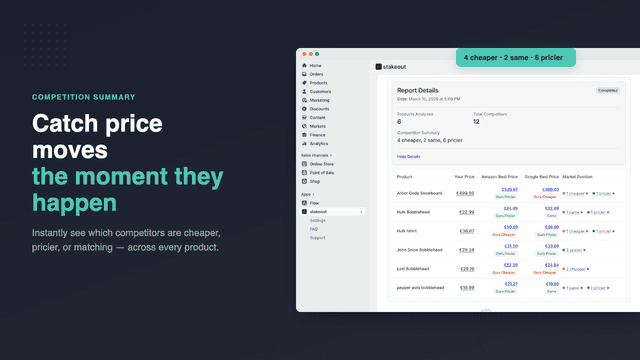
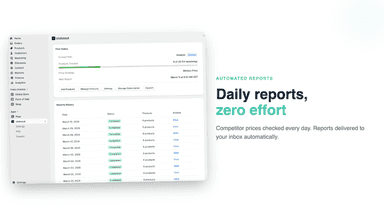
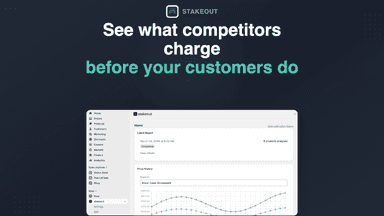
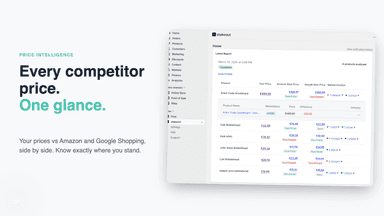
Stakeout monitors competitor prices on Amazon, Google Shopping and normal Google search results so you always know where you stand. Search via Product title or UPC / EAN / Barcode. Get daily reports delivered automatically, spot price drops the moment they happen, and track pricing trends over time. No complex rules to configure, no repricing engine to babysit.
- See how different price points relate to product results.
- Review a recommended price while keeping the final decision manual.
- Compare not only past profit, but also how stable the results were.
- Use star ratings to identify stronger and weaker products.
- Auto-discovery of competitor listings and prices across major retailers
- Track prices across Amazon and Google Shopping from one dashboard
- Continuous price monitoring alerts you to competitor pricing adjustments.
- See price history trends with visual charts to spot patterns over time


All the numbers
Every figure, side by side
A green dot marks the app ahead on a measured figure. Estimates, gaps and apps that leave no storefront trace never take the lead.
Adoption
| Measure |  PriceCraft Pricing Graph |  Stakeout |
|---|---|---|
| Detected stores | Not published | Not published |
| Net store change, 28 days | 0 | 0 |
| Stores added, 28 days | Not enough data | Not enough data |
| Big-brand share | Not enough data | Not enough data |
| Top store categories | Not published | Not published |
| Top store countries | Not published | Not published |
Reviews
| Measure | PriceCraft Pricing Graph | Stakeout |
|---|---|---|
| App Store rating | Not published | Not published |
| App Store reviews | Not published | Not published |
| New reviews, 28 days | Not enough data | Not enough data |
| Reviewers a year or more in | Not enough data | Not enough data |
Pricing
| Measure | PriceCraft Pricing Graph | Stakeout |
|---|---|---|
| Free plan | Not listed | Not listed |
| Lowest paid monthly plan | No monthly plan listed | $19/month |
| Longest free trial | 30 days | 5 days |
| Plans listed | 1 | 3 |
Listing
| Measure | PriceCraft Pricing Graph | Stakeout |
|---|---|---|
| Shopify category rank | Not enough data | #1621 |
| Shopify App Charts | Not on this week’s charts | Not on this week’s charts |
| Built for Shopify | No | No |
| Launched | May 25, 2026 | Apr 27, 2026 |
| Languages | 1 | 1 |
| Developer | Honama | Elite App Wizards |
FAQ
PriceCraft Pricing Graph and Stakeout: common questions
- What features does each app list that the other doesn’t?
- Stakeout lists 3 the others don’t mention, such as Custom reports, Profit insights, Report scheduling. A feature missing from a listing may still be supported; this compares what each App Store listing says.
- Where does this comparison’s data come from?
- Shoplist crawls Shopify storefronts to detect which apps each store runs, and reads each app’s Shopify App Store listing for reviews, pricing, features and integrations. Store counts are as of Oct 13, 2026; estimated figures are labeled.
How Shoplist compares apps
Store counts come from Shoplist’s crawl of Shopify storefronts, which detects the apps each store runs; they are as of Oct 13, 2026. Reviews, ratings, plans, features and integrations come from each app’s Shopify App Store listing. 28-day figures are labeled when estimated, and a figure that is missing or estimated never decides who leads. Read the methodology.