

PixieHog vs Pliable E‑Commerce Analytics
Two Shopify apps, side by side: detected stores, momentum, reviews, plans, listed features and who runs each. Store counts as of Nov 13, 2026 for PixieHog, Oct 13, 2026 for Pliable E‑Commerce Analytics.
The short answer
- Pliable E‑Commerce Analytics lists 8 features PixieHog’s listing doesn’t mention, including Abandoned cart, AI insights, Analytics dashboard.
Head to head


- United States
- United Kingdom
- Canada
Momentum
New reviews each month
Review pace is the clearest public read on how fast an app is winning new merchants.
Pliable Base
Coverage counts what each App Store listing names. Every feature, checked off app by app, is in Shoplist.
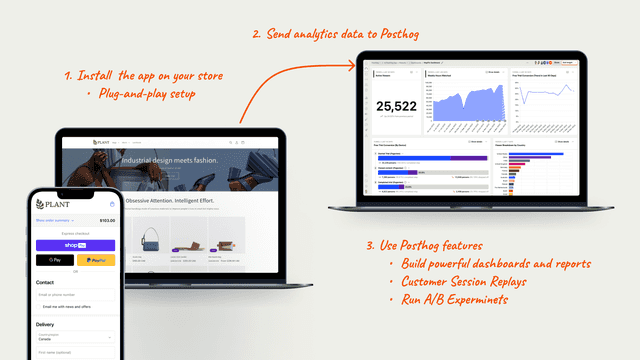
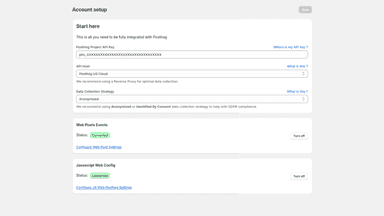
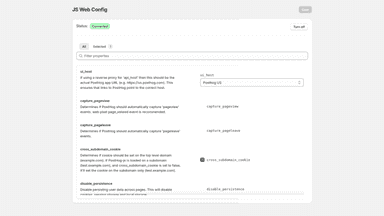
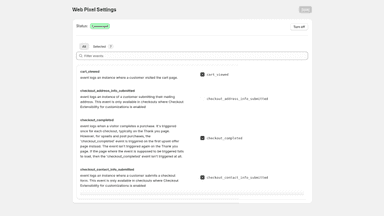
See every featureEasily send data from your store to PostHog and leverage its features. PostHog provides an extensive suit of tools to build successful products. Product Analytics, Session Replays, Experiments and more! Build custom reports, dashboard and funnels suited to your business requirements.
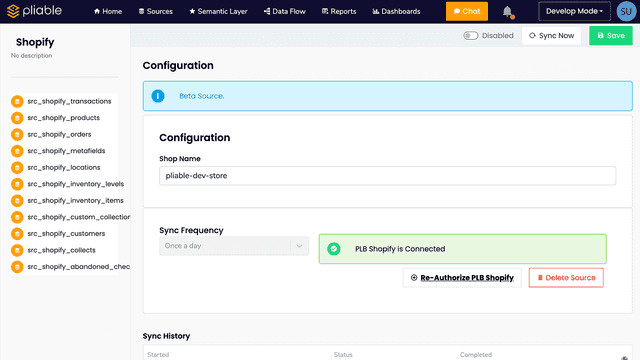
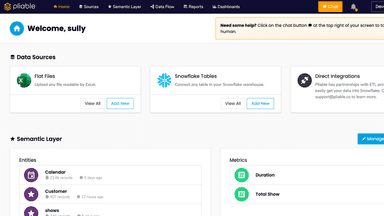
Pliable equips consumer brands with insights and reports for critical business decisions to scale growth. Track sales across platforms, profit, calculate precise lifetime value (LTV) and marketing analytics, and identify patterns in customer purchase behavior.
- Plug-and-play.
- Track customers across all surfaces: storefront, checkout and post-purchase.
- Compatible with Checkout Extensibility.
- Simplified customer privacy and GDPR compliance.
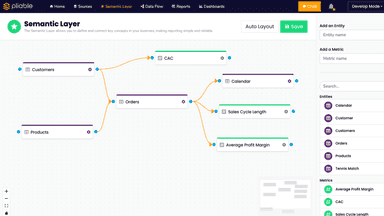
- No-Code data modeling tool.
- Automatic syncing from Shopify, so your warehouse is always up to date.
- Semantic layer to drive custom reports for your organization.


All the numbers
Every figure, side by side
A green dot marks the app ahead on a measured figure. Estimates, gaps and apps that leave no storefront trace never take the lead.
Adoption
| Measure |  PixieHog |  Pliable E‑Commerce Analytics |
|---|---|---|
| Detected stores | 463 | Not published |
| Net store change, 28 days | +17 | 0 |
| Stores added, 28 days | 20 | Not enough data |
| Big-brand share | 17% | Not enough data |
| Top store categories | Apparel & Accessories, Health & Beauty, Home & Garden | Not published |
| Top store countries | United States, United Kingdom, Canada | Not published |
Reviews
| Measure | PixieHog | Pliable E‑Commerce Analytics |
|---|---|---|
| App Store rating | 5.0 ★ | Not published |
| App Store reviews | 3 | Not published |
| New reviews, 28 days | Not enough data | Not enough data |
| Reviewers a year or more in | Not enough data | Not enough data |
Pricing
| Measure | PixieHog | Pliable E‑Commerce Analytics |
|---|---|---|
| Free plan | Not listed | Not listed |
| Lowest paid monthly plan | No monthly plan listed | $699/month |
| Longest free trial | Not listed | 14 days |
| Plans listed | Not published | 1 |
Listing
| Measure | PixieHog | Pliable E‑Commerce Analytics |
|---|---|---|
| Shopify category rank | #122(ahead) | #638 |
| Shopify App Charts | Not on this week’s charts | Not on this week’s charts |
| Built for Shopify | No | No |
| Launched | Dec 4, 2024 | Mar 13, 2025 |
| Languages | 1 | 1 |
| Developer | CeladonWorks | Pliable |
FAQ
PixieHog and Pliable E‑Commerce Analytics: common questions
- What features does each app list that the other doesn’t?
- PixieHog lists 7 the others don’t mention, such as Checkout analytics, GDPR compliance, Pixel tracking, Real-time tracking. Pliable E‑Commerce Analytics lists 8 the others don’t mention, such as Abandoned cart, AI insights, Analytics dashboard, Benchmarking. A feature missing from a listing may still be supported; this compares what each App Store listing says.
- Where does this comparison’s data come from?
- Shoplist crawls Shopify storefronts to detect which apps each store runs, and reads each app’s Shopify App Store listing for reviews, pricing, features and integrations. Store counts are as of Nov 13, 2026 for PixieHog, Oct 13, 2026 for Pliable E‑Commerce Analytics; estimated figures are labeled.
How Shoplist compares apps
Store counts come from Shoplist’s crawl of Shopify storefronts, which detects the apps each store runs; they are as of Nov 13, 2026 for PixieHog, Oct 13, 2026 for Pliable E‑Commerce Analytics. Reviews, ratings, plans, features and integrations come from each app’s Shopify App Store listing. 28-day figures are labeled when estimated, and a figure that is missing or estimated never decides who leads. Read the methodology.