
Peci: Revenue Radar vs Revenue Leak Detector
Two Shopify apps, side by side: detected stores, momentum, reviews, plans, listed features and who runs each. Store counts as of Nov 16, 2026 for Peci, Feb 19, 2026 for Revenue Leak Detector.
The short answer
- Only Peci lists a free plan.
- Revenue Leak Detector lists 8 features Peci’s listing doesn’t mention, including Activity tracking, AI insights, Benchmarking.
Head to head

Basic Insight
- · Bot-filtered figures
- · Checkout abandonment overview
- · Covers 500 unique visitors a month
Pro Optimizer
- · Everything in Basic Insight
- · Exportable product lists (CSV)
- · No visitor limit
- · Problem-product alerts
- · Product-level breakdown
- · Revenue loss over time
Coverage counts what each App Store listing names. Every feature, checked off app by app, is in Shoplist.
See every featureRevenue Radar shows Shopify merchants where checkout is leaking revenue. Instead of one abandonment percentage, see which products are losing sales and why, with bot traffic filtered out so the numbers reflect real shoppers. The app never emails or texts your customers: it's a dashboard for you, not another channel for them. Bot-filtered figures, revenue loss over time and a product-level breakdown.
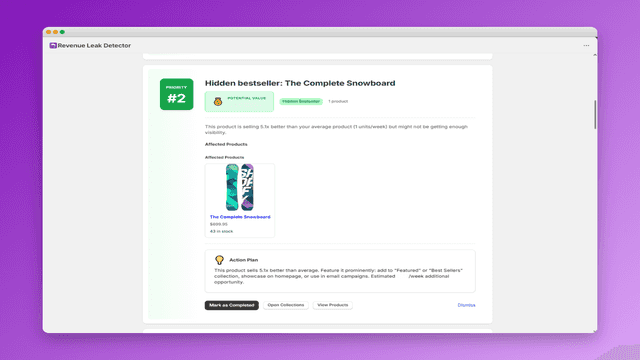
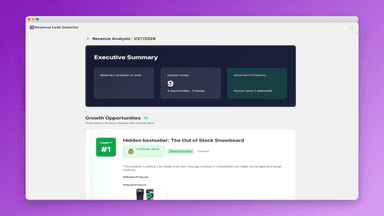
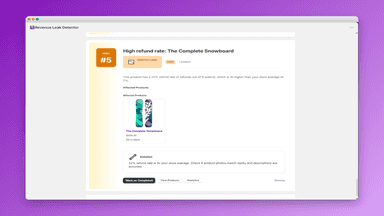
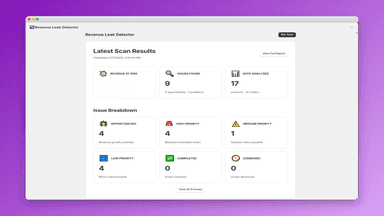
Scans your products, orders, and inventory to find fixable issues losing you money. Detects: out-of-stock items with demand, bestsellers needing better placement, products with high refund rates, low-margin items, unpopular variants, discount overuse, and poor add-to-cart conversion. Shows weekly revenue impact for each issue, explains how to fix it, and tracks resolved leaks.
- Bot-filtered abandonment figures: crawler traffic never inflates your numbers.
- Product-level breakdown: see which specific products lose the most revenue.
- Revenue loss over time: lost value per day and whether it is rising or falling.
- Go over your visitor limit and tracking keeps running, with a notice.
- Scans products, orders, and inventory to detect 7 types of revenue leaks
- Calculates weekly revenue impact and opportunity cost for each detected issue
- Provides fix instructions and recommendations for every leak found
- Tracks resolved leaks and measures recovered revenue over time
All the numbers
Every figure, side by side
A green dot marks the app ahead on a measured figure. Estimates, gaps and apps that leave no storefront trace never take the lead.
Adoption
| Measure |  Revenue Leak Detector | |
|---|---|---|
| Detected stores | Not published | Not published |
| Net store change, 28 days | 0 | 0 |
| Stores added, 28 days | Not enough data | Not enough data |
| Big-brand share | Not enough data | Not enough data |
| Top store categories | Not published | Not published |
| Top store countries | Not published | Not published |
Reviews
| Measure | Revenue Leak Detector | |
|---|---|---|
| App Store rating | Not published | Not published |
| App Store reviews | Not published | Not published |
| New reviews, 28 days | Not enough data | Not enough data |
| Reviewers a year or more in | Not enough data | Not enough data |
Pricing
| Measure | Revenue Leak Detector | |
|---|---|---|
| Free plan | Yes | Not listed |
| Lowest paid monthly plan | $29.99/month | No monthly plan listed |
| Longest free trial | 14 days | Not listed |
| Plans listed | 2 | Not published |
Listing
| Measure | Revenue Leak Detector | |
|---|---|---|
| Shopify category rank | Not enough data | #1281 |
| Shopify App Charts | Not on this week’s charts | Not on this week’s charts |
| Built for Shopify | No | No |
| Launched | Nov 9, 2026 | Feb 13, 2026 |
| Languages | 1 | 1 |
| Developer | Péci Kft | CARSENSE PTY LTD |
FAQ
Peci and Revenue Leak Detector: common questions
- Is Peci or Revenue Leak Detector cheaper?
- Only Peci lists a free plan. Shoplist compares base prices only between monthly plans in the same currency; usage charges and annual plans vary, so check each plan’s limits.
- What features does each app list that the other doesn’t?
- Peci lists 2 the others don’t mention, such as Data export, Pixel tracking. Revenue Leak Detector lists 8 the others don’t mention, such as Activity tracking, AI insights, Benchmarking, Broken links. A feature missing from a listing may still be supported; this compares what each App Store listing says.
- Where does this comparison’s data come from?
- Shoplist crawls Shopify storefronts to detect which apps each store runs, and reads each app’s Shopify App Store listing for reviews, pricing, features and integrations. Store counts are as of Nov 16, 2026 for Peci, Feb 19, 2026 for Revenue Leak Detector; estimated figures are labeled.
How Shoplist compares apps
Store counts come from Shoplist’s crawl of Shopify storefronts, which detects the apps each store runs; they are as of Nov 16, 2026 for Peci, Feb 19, 2026 for Revenue Leak Detector. Reviews, ratings, plans, features and integrations come from each app’s Shopify App Store listing. 28-day figures are labeled when estimated, and a figure that is missing or estimated never decides who leads. Read the methodology.