

Ordinary: Attribution + A/B vs ABC Store Analytics
Two Shopify apps, side by side: detected stores, momentum, reviews, plans, listed features and who runs each. Store counts as of Nov 9, 2026 for Ordinary, Sep 3, 2026 for ABC Store Analytics.
The short answer
- Only Ordinary lists a free plan.
- Ordinary lists 12 features ABC Store Analytics’s listing doesn’t mention, including AI insights, Benchmarking, Data export.
Head to head


- United Kingdom
- United States
- Australia
Momentum
New reviews each month
Review pace is the clearest public read on how fast an app is winning new merchants.
Free
- · 1 seat · chat support
- · 30 days of report history
- · A/B testing included
- · First & last-click attribution
- · First-party pixel, ad-blocker resistant
- · For any Shopify store
Starter
- · 5 team seats
- · Customer journey mapping
- · Everything in Free, plus:
- · Meta, Google, Klaviyo & more
- · Multi-touch attribution models
- · Subscription-aware attribution
Advanced
- · AI-powered session replays
- · Cohort retention & LTV
- · Creative analytics studio
- · Everything in Starter, plus:
- · Inventory & logistics
- · Offer calculator
Coverage counts what each App Store listing names. Every feature, checked off app by app, is in Shoplist.
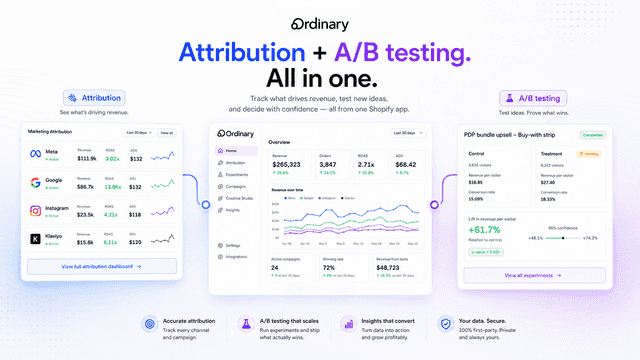
See every featureStop guessing which ads work. Ordinary's first-party pixel matches clicks from your Meta, Google, and Klaviyo campaigns to real Shopify orders. See ROAS and CAC by channel and campaign, LTV and cohorts, and A/B test store changes to measure the real revenue lift. Session replays show where shoppers hesitate and rank your costliest checkout friction, so you fix what loses money first.
Built for store owners, marketers, ecommerce agencies, solopreneurs, & brand managers. Shopify, Meta, Google, Klaviyo & Amazon on one screen — with profit line underneath. Built by three operators who already made the expensive mistakes. We built the app we wanted for our own stores. We hate too many KPIs & too much noise — so we kept it simple.
- See which channels and campaigns actually drive your sales
- A/B test changes to your store and measure the real lift on revenue
- Compare performance across Shopify, ads, and marketplaces in one view
- Watch how real shoppers browse and where they abandon checkout
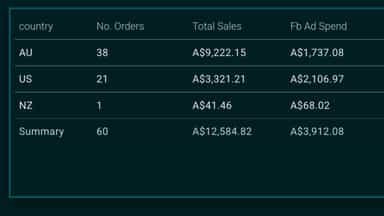
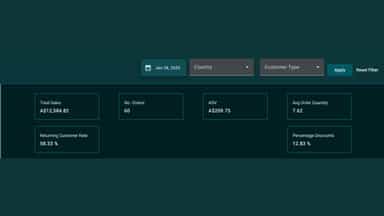
- Unified Dashboard – Track MER, top ads, sales, and trends in one place.
- Ad & Product Insights – Identify top-performing ads and top-selling products.
- Omnichannel Reporting – View data from Shopify in real time.




All the numbers
Every figure, side by side
A green dot marks the app ahead on a measured figure. Estimates, gaps and apps that leave no storefront trace never take the lead.
Adoption
| Measure |  Ordinary |  ABC Store Analytics |
|---|---|---|
| Detected stores | 8 | Not published |
| Net store change, 28 days | 0 | 0 |
| Stores added, 28 days | Not enough data | Not enough data |
| Big-brand share | Not enough data | Not enough data |
| Top store categories | Food, Beverages & Tobacco, Health & Beauty, Home & Garden | Not published |
| Top store countries | United Kingdom, United States, Australia | Not published |
Reviews
| Measure | Ordinary | ABC Store Analytics |
|---|---|---|
| App Store rating | Not published | 5.0 ★ |
| App Store reviews | Not published | 11 |
| New reviews, 28 days | Not enough data | Not enough data |
| Reviewers a year or more in | Not enough data | Not enough data |
Pricing
| Measure | Ordinary | ABC Store Analytics |
|---|---|---|
| Free plan | Yes | Not listed |
| Lowest paid monthly plan | $99/month | No monthly plan listed |
| Longest free trial | Not listed | Not listed |
| Plans listed | 3 | Not published |
Listing
| Measure | Ordinary | ABC Store Analytics |
|---|---|---|
| Shopify category rank | #732 | #123(ahead) |
| Shopify App Charts | Not on this week’s charts | Not on this week’s charts |
| Built for Shopify | No | No |
| Launched | Jun 16, 2026 | Jun 13, 2025 |
| Languages | 1 | 1 |
| Developer | Rendr | ABC Store Analytics |
FAQ
Ordinary and ABC Store Analytics: common questions
- Is Ordinary or ABC Store Analytics cheaper?
- Only Ordinary lists a free plan. Shoplist compares base prices only between monthly plans in the same currency; usage charges and annual plans vary, so check each plan’s limits.
- What features does each app list that the other doesn’t?
- Ordinary lists 12 the others don’t mention, such as AI insights, Benchmarking, Data export, Event tracking. ABC Store Analytics lists 2 the others don’t mention, such as Abandoned cart, Multi-store reports. A feature missing from a listing may still be supported; this compares what each App Store listing says.
- Where does this comparison’s data come from?
- Shoplist crawls Shopify storefronts to detect which apps each store runs, and reads each app’s Shopify App Store listing for reviews, pricing, features and integrations. Store counts are as of Nov 9, 2026 for Ordinary, Sep 3, 2026 for ABC Store Analytics; estimated figures are labeled.
How Shoplist compares apps
Store counts come from Shoplist’s crawl of Shopify storefronts, which detects the apps each store runs; they are as of Nov 9, 2026 for Ordinary, Sep 3, 2026 for ABC Store Analytics. Reviews, ratings, plans, features and integrations come from each app’s Shopify App Store listing. 28-day figures are labeled when estimated, and a figure that is missing or estimated never decides who leads. Read the methodology.