

OEP: Export Orders to Report vs Export Reports and Dashboards
Two Shopify apps, side by side: detected stores, momentum, reviews, plans, listed features and who runs each. Store counts as of Nov 6, 2026 for OEP, Oct 14, 2026 for Export Reports and Dashboards.
The short answer
- Paid plans start at $9.95/month for OEP and $97/month for Export Reports and Dashboards.
- Export Reports and Dashboards lists 4 features OEP’s listing doesn’t mention, including Analytics dashboard, Historical analysis, Lifetime value (LTV).
Head to head


Export orders to XLS (Excel) or CSV in custom format.
Momentum
New reviews each month
Review pace is the clearest public read on how fast an app is winning new merchants.
Unlimited Plan
- · 90+ order attributes to use in report
- · All app features available
- · Order Note Attributes
- · Orders Line Item Properties
Lite
Pro
Business
Coverage counts what each App Store listing names. Every feature, checked off app by app, is in Shoplist.
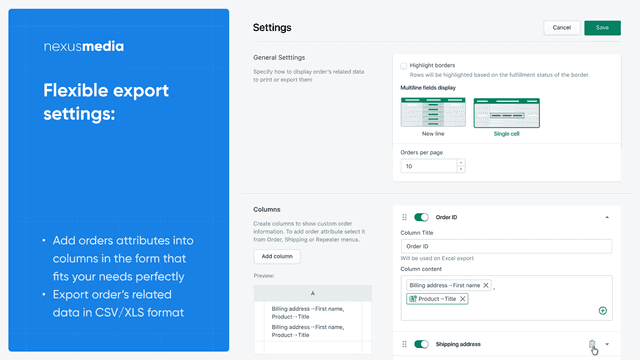
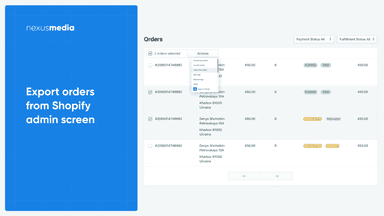
See every featureSimplify export orders details to XLS and CSV sheets. Export orders to Sheets with any set of columns: order number/ID, ordered Items (with any needed information, like SKU, Quantity, Price, etc), fulfillment data (like Tracking Number, Tracking URL, fulfillment status and more), customer information (like name, email, billing and shipping address, etc), referring website / Landing URL (useful for marketing purposes…
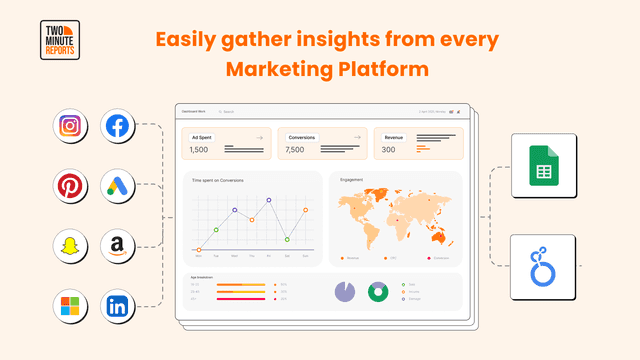
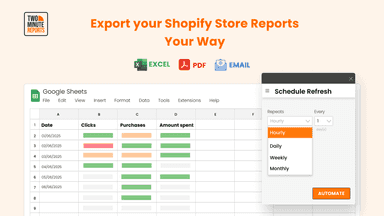
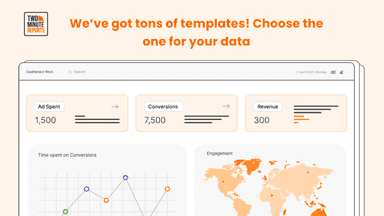
Two Minute Reports helps Shopify store owners automate reporting and understand their store performance with clear, actionable insights. Track sales, orders, product performance, inventory, discounts, and refunds in one place. Use Dash AI to generate performance summaries, spot trends, and understand what’s changing in your store.
- Export orders to Excel in XLS or CSV format.
- Create as many columns as you need with order details you need.
- Flexible column editor to combine fields you need in a single column.
- Export Orders with details on products, customers, payments, refunds, and taxes.
- Build custom sales reports by day, product, variant, or SKU.
- Track inventory and forecast restocks with accurate data.
- Export discount code usage to improve marketing analytics and campaign tracking.


All the numbers
Every figure, side by side
A green dot marks the app ahead on a measured figure. Estimates, gaps and apps that leave no storefront trace never take the lead.
Adoption
| Measure |  OEP |  Export Reports and Dashboards |
|---|---|---|
| Detected stores | Not published | Not published |
| Net store change, 28 days | 0 | 0 |
| Stores added, 28 days | Not enough data | Not enough data |
| Big-brand share | Not enough data | Not enough data |
| Top store categories | Not published | Not published |
| Top store countries | Not published | Not published |
Reviews
| Measure | OEP | Export Reports and Dashboards |
|---|---|---|
| App Store rating | 4.7 ★ | Not published |
| App Store reviews | 23 | Not published |
| New reviews, 28 days | 1 | Not enough data |
| Reviewers a year or more in | Not enough data | Not enough data |
Pricing
| Measure | OEP | Export Reports and Dashboards |
|---|---|---|
| Free plan | Not listed | Not listed |
| Lowest paid monthly plan | $9.95/month(ahead) | $97/month |
| Longest free trial | 7 days | 14 days |
| Plans listed | 1 | 3 |
Listing
| Measure | OEP | Export Reports and Dashboards |
|---|---|---|
| Shopify category rank | #115 | #168 |
| Shopify App Charts | Not on this week’s charts | Not on this week’s charts |
| Built for Shopify | No | No |
| Launched | Nov 28, 2019 | Nov 24, 2025 |
| Languages | 1 | 1 |
| Developer | NexusMedia | twominutereports.com |
FAQ
OEP and Export Reports and Dashboards: common questions
- Is OEP or Export Reports and Dashboards cheaper?
- Paid plans start at $9.95/month for OEP and $97/month for Export Reports and Dashboards. Shoplist compares base prices only between monthly plans in the same currency; usage charges and annual plans vary, so check each plan’s limits.
- What features does each app list that the other doesn’t?
- Export Reports and Dashboards lists 4 the others don’t mention, such as Analytics dashboard, Historical analysis, Lifetime value (LTV), Marketing attribution. A feature missing from a listing may still be supported; this compares what each App Store listing says.
- Where does this comparison’s data come from?
- Shoplist crawls Shopify storefronts to detect which apps each store runs, and reads each app’s Shopify App Store listing for reviews, pricing, features and integrations. Store counts are as of Nov 6, 2026 for OEP, Oct 14, 2026 for Export Reports and Dashboards; estimated figures are labeled.
How Shoplist compares apps
Store counts come from Shoplist’s crawl of Shopify storefronts, which detects the apps each store runs; they are as of Nov 6, 2026 for OEP, Oct 14, 2026 for Export Reports and Dashboards. Reviews, ratings, plans, features and integrations come from each app’s Shopify App Store listing. 28-day figures are labeled when estimated, and a figure that is missing or estimated never decides who leads. Read the methodology.