

ORCA Analytics vs Origin: Attribution & Profit
Two Shopify apps, side by side: detected stores, momentum, reviews, plans, listed features and who runs each. Store counts as of Oct 14, 2026 for ORCA Analytics, Nov 11, 2026 for Origin.
The short answer
- Paid plans start at $599/month for ORCA Analytics and $29/month for Origin.
- ORCA Analytics lists 9 features Origin’s listing doesn’t mention, including Benchmarking, Cohort analysis, Custom dashboards.
Head to head


- United States
- Czechia
- India
Momentum
New reviews each month
Review pace is the clearest public read on how fast an app is winning new merchants.
Go-To-Market
- · CEO Snapshot
- · Channel Heatmaps
- · Cohorts + LTV:CAC
- · Creative Views
- · HDYHAU Attribution
- · Targets vs Actuals
Growth
- · + Product Basket Analyses
- · + Subscription vs OTP Cohorts
- · + Weighted Pacing
- · Everything in Base, plus...
Scale
- · + Data replicated into Google Sheet
- · + Intraday (real-time) Reporting
- · + Multi-region reporting
- · Everything in Scale, plus...
Pro
- · 1-year attribution window
- · 2,000 orders/month
- · Custom costs & profit tracking
- · MCP server
- · Meta Ads & Google Ads integration
- · Multi-touch attribution
Platinum
- · 1-year attribution window
- · 10,000 orders/month
- · Custom costs & profit tracking
- · MCP server
- · Meta Ads & Google Ads integration
- · Multi-touch attribution
Coverage counts what each App Store listing names. Every feature, checked off app by app, is in Shoplist.
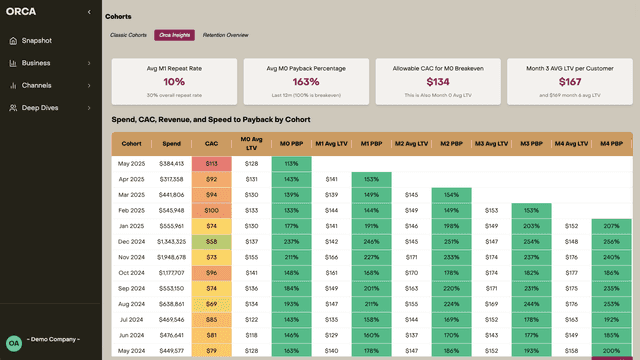
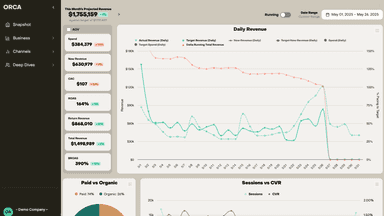
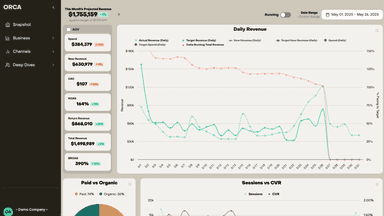
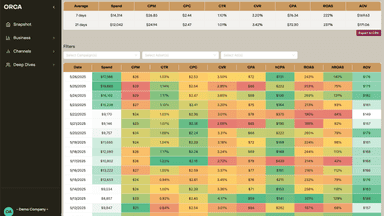
See every featureORCA helps brands understand business and channel level performance by combining ad platform data, attribution, and sales. Track pacing vs. goals, forecast revenue using cohorts, benchmarks, and seasonal trends, analyze customer journey by product, and LTV by channel. ORCA gives clarity to your growth strategy, without switching between dashboards.
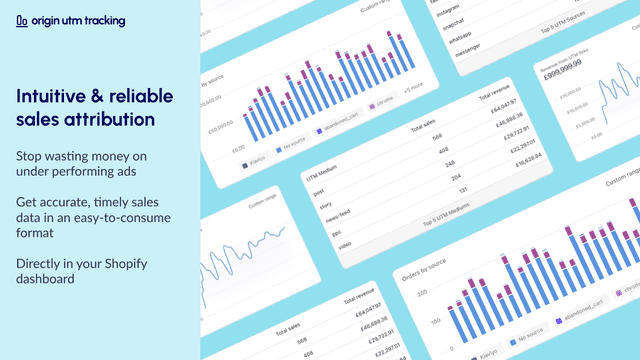
Origin improves your order attribution data and tracks more orders than regular analytics. Beat ad blockers, cookie banners, and iOS 14 limitations with our server side attribution system. Get metrics you can't normally see: LTV, new vs. return customers, net profit, and true ROAS (including LTV) for each ad, campaign, & UTM link.
- Set revenue & CAC/MER targets and track pacing of actuals vs targets
- Attribution to understand incremental impact of ad spend across channels
- Creative performance to see which ads drive the highest CTR/CPA/ROAS
- View LTV and customer journey by product or acquisition channel
- Reliable and accurate UTM analytics
- Instant order attribution - no need to wait days to see results
- Quickly find your top-performing sources and campaigns
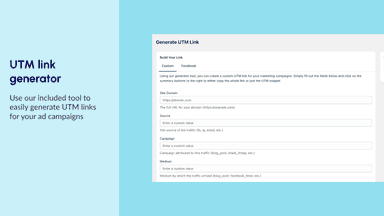
- Generate UTM links and snippets that plug directly into FB Ads



All the numbers
Every figure, side by side
A green dot marks the app ahead on a measured figure. Estimates, gaps and apps that leave no storefront trace never take the lead.
Adoption
| Measure |  ORCA Analytics |  Origin |
|---|---|---|
| Detected stores | Not published | 102 |
| Net store change, 28 days | 0 | +4 |
| Stores added, 28 days | Not enough data | 4 |
| Big-brand share | Not enough data | Not enough data |
| Top store categories | Not published | Health & Beauty, Sporting Goods, Apparel & Accessories |
| Top store countries | Not published | United States, Czechia, India |
Reviews
| Measure | ORCA Analytics | Origin |
|---|---|---|
| App Store rating | Not published | 5.0 ★ |
| App Store reviews | Not published | 34 |
| New reviews, 28 days | Not enough data | 0 |
| Reviewers a year or more in | Not enough data | Not enough data |
Pricing
| Measure | ORCA Analytics | Origin |
|---|---|---|
| Free plan | Not listed | Not listed |
| Lowest paid monthly plan | $599/month | $29/month(ahead) |
| Longest free trial | 14 days | 14 days |
| Plans listed | 3 | 2 |
Listing
| Measure | ORCA Analytics | Origin |
|---|---|---|
| Shopify category rank | #323 | #40(ahead) |
| Shopify App Charts | Not on this week’s charts | Not on this week’s charts |
| Built for Shopify | No | Yes |
| Launched | Jul 3, 2025 | Nov 11, 2022 |
| Languages | 1 | 1 |
| Developer | ORCA Analytics | Origin Attribution |
FAQ
ORCA Analytics and Origin: common questions
- Is ORCA Analytics or Origin cheaper?
- Paid plans start at $599/month for ORCA Analytics and $29/month for Origin. Shoplist compares base prices only between monthly plans in the same currency; usage charges and annual plans vary, so check each plan’s limits.
- What features does each app list that the other doesn’t?
- ORCA Analytics lists 9 the others don’t mention, such as Benchmarking, Cohort analysis, Custom dashboards, Custom reports. Origin lists 1 the others don’t mention, such as Event tracking. A feature missing from a listing may still be supported; this compares what each App Store listing says.
- Where does this comparison’s data come from?
- Shoplist crawls Shopify storefronts to detect which apps each store runs, and reads each app’s Shopify App Store listing for reviews, pricing, features and integrations. Store counts are as of Oct 14, 2026 for ORCA Analytics, Nov 11, 2026 for Origin; estimated figures are labeled.
How Shoplist compares apps
Store counts come from Shoplist’s crawl of Shopify storefronts, which detects the apps each store runs; they are as of Oct 14, 2026 for ORCA Analytics, Nov 11, 2026 for Origin. Reviews, ratings, plans, features and integrations come from each app’s Shopify App Store listing. 28-day figures are labeled when estimated, and a figure that is missing or estimated never decides who leads. Read the methodology.