

Oogwai Analytics vs Pivotal Analytics
Two Shopify apps, side by side: detected stores, momentum, reviews, plans, listed features and who runs each. Store counts as of Feb 19, 2026.
The short answer
- Oogwai Analytics lists 8 features Pivotal Analytics’s listing doesn’t mention, including Abandoned cart, Checkout analytics, Event tracking.
Head to head


Coverage counts what each App Store listing names. Every feature, checked off app by app, is in Shoplist.
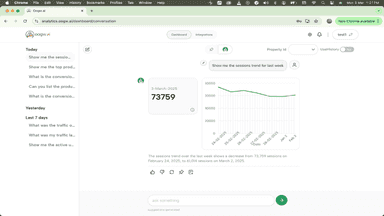
See every featureOogwai provides a Natural Language interface that helps merchants analyze and visualize the store data. It combines this information with other sources like GA, Ads data, spends data to provide a overall, holistic and simplistic view of their entire store performance. The app provides a simple interface to query data from all sources that affect their store performance and retrieve it on a regular basis.
Monitor customer activity in your Shopify store, including add-to-cart, view cart, purchases, and refunds. Gain valuable insights into shopper behavior and trends to understand your store’s performance. The app integrates seamlessly with Shopify, is easy to install, and allows merchants to track key interactions.
- Easily query Shopify data and other data with simple english.
- Visualize key performance metrics with simple, intuitive data charts
- Get alerted on anomalies and unexpected changes in your store’s performance
- Track purchases, refunds, and cart actions in real-time with detailed metrics.
- Connect and start tracking instantly with no technical setup required.
- Monitor orders, cancellations, and customer behavior across your entire store.





All the numbers
Every figure, side by side
A green dot marks the app ahead on a measured figure. Estimates, gaps and apps that leave no storefront trace never take the lead.
Adoption
| Measure |  Oogwai Analytics |  Pivotal Analytics |
|---|---|---|
| Detected stores | Not published | Not published |
| Net store change, 28 days | 0 | 0 |
| Stores added, 28 days | Not enough data | Not enough data |
| Big-brand share | Not enough data | Not enough data |
| Top store categories | Not published | Not published |
| Top store countries | Not published | Not published |
Reviews
| Measure | Oogwai Analytics | Pivotal Analytics |
|---|---|---|
| App Store rating | Not published | Not published |
| App Store reviews | Not published | Not published |
| New reviews, 28 days | Not enough data | Not enough data |
| Reviewers a year or more in | Not enough data | Not enough data |
Pricing
| Measure | Oogwai Analytics | Pivotal Analytics |
|---|---|---|
| Free plan | Not listed | Not listed |
| Lowest paid monthly plan | No monthly plan listed | No monthly plan listed |
| Longest free trial | Not listed | Not listed |
| Plans listed | Not published | Not published |
Listing
| Measure | Oogwai Analytics | Pivotal Analytics |
|---|---|---|
| Shopify category rank | #1279 | #1085(ahead) |
| Shopify App Charts | Not on this week’s charts | Not on this week’s charts |
| Built for Shopify | No | No |
| Launched | Jul 28, 2025 | Oct 9, 2025 |
| Languages | 1 | 1 |
| Developer | Oogwai Analytics | PVTL Limited |
FAQ
Oogwai Analytics and Pivotal Analytics: common questions
- What features does each app list that the other doesn’t?
- Oogwai Analytics lists 8 the others don’t mention, such as Abandoned cart, Checkout analytics, Event tracking, Funnel analysis. Pivotal Analytics lists 1 the others don’t mention, such as Real-time tracking. A feature missing from a listing may still be supported; this compares what each App Store listing says.
- Where does this comparison’s data come from?
- Shoplist crawls Shopify storefronts to detect which apps each store runs, and reads each app’s Shopify App Store listing for reviews, pricing, features and integrations. Store counts are as of Feb 19, 2026; estimated figures are labeled.
How Shoplist compares apps
Store counts come from Shoplist’s crawl of Shopify storefronts, which detects the apps each store runs; they are as of Feb 19, 2026. Reviews, ratings, plans, features and integrations come from each app’s Shopify App Store listing. 28-day figures are labeled when estimated, and a figure that is missing or estimated never decides who leads. Read the methodology.