

Niblin: AI FP&A & Forecasting vs VAL
Two Shopify apps, side by side: detected stores, momentum, reviews, plans, listed features and who runs each. Store counts as of Nov 6, 2026 for Niblin, Feb 19, 2026 for VAL.
The short answer
- Niblin lists 9 features VAL’s listing doesn’t mention, including AI insights, Analytics dashboard, Custom dashboards.
Head to head


Automate your accounting
Momentum
New reviews each month
Review pace is the clearest public read on how fast an app is winning new merchants.
Growth
- · 3 seats
- · AI agent — ask anything in plain English
- · All advanced reports
- · Build custom dashboards & workspaces
- · Email support (24-hour response)
- · Morning Briefing & alerts via email
Pro
- · 10 seats
- · AI agent — ask anything in plain English
- · All advanced reports
- · Build custom dashboards & workspaces
- · Morning Briefing & alerts via email
- · Persistent memory across conversations
Scale
- · 25 seats
- · AI agent — ask anything in plain English
- · All advanced reports
- · Build custom dashboards & workspaces
- · Dedicated CSM + white-glove onboarding
- · Morning Briefing & alerts via email
Coverage counts what each App Store listing names. Every feature, checked off app by app, is in Shoplist.
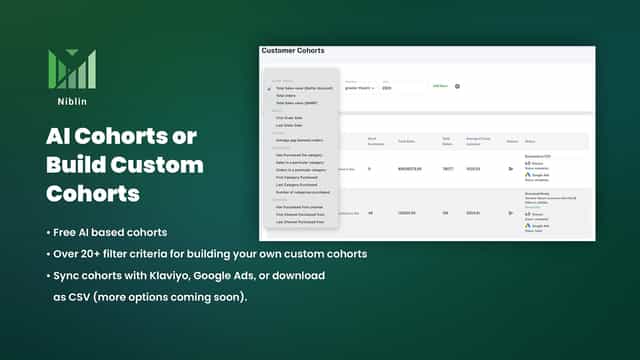
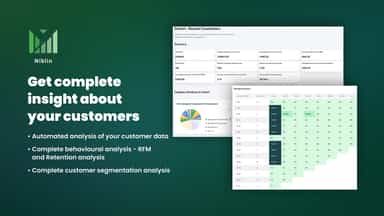
See every featureNiblin is AI-powered FP&A built for brands that sell on more than one channel. It brings your store's orders, discounts, returns and payouts together with your books, marketplaces, retailers and 3PL in one model that already knows consumer-brand economics. Plan budgets with approval workflows, run rolling forecasts by channel and SKU, and see contribution margin after every fee, return and marketing cost.
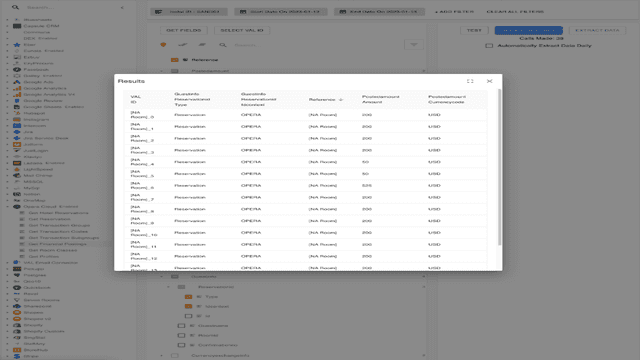
Align values across multiple systems automatically without writing code. Change the mapping as and when you need. Automate the process of enriching your raw data either to segment your customer or extract value from text. Automate and let it run. Calculate your sales per manhour, conversion ratio, pro-rated sales target and many more metrics. Let us be your data calculator.
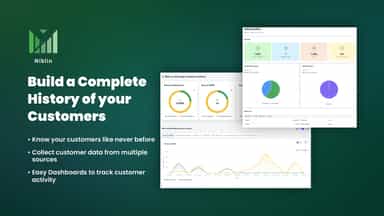
- Maximize Sales: Unlock revenue streams & sales based on data
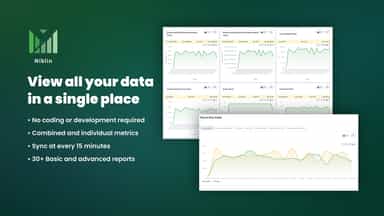
- Consolidate data into an intuitive dashboard for effortless tracking
- Tailor marketing for higher conversions with actionable insights.
- Nurture loyalty with targeted promotions & personalized recommendations.
- able to pull data from different APIs
- data visualization
- no-code customisable data platform packed with industry specific solutions.
All the numbers
Every figure, side by side
A green dot marks the app ahead on a measured figure. Estimates, gaps and apps that leave no storefront trace never take the lead.
Adoption
| Measure |  Niblin |  VAL |
|---|---|---|
| Detected stores | Not published | Not published |
| Net store change, 28 days | 0 | 0 |
| Stores added, 28 days | Not enough data | Not enough data |
| Big-brand share | Not enough data | Not enough data |
| Top store categories | Not published | Not published |
| Top store countries | Not published | Not published |
Reviews
| Measure | Niblin | VAL |
|---|---|---|
| App Store rating | 5.0 ★ | Not published |
| App Store reviews | 3 | Not published |
| New reviews, 28 days | 0 | Not enough data |
| Reviewers a year or more in | Not enough data | Not enough data |
FAQ
Niblin and VAL: common questions
- What features does each app list that the other doesn’t?
- Niblin lists 9 the others don’t mention, such as AI insights, Analytics dashboard, Custom dashboards, Custom reports. A feature missing from a listing may still be supported; this compares what each App Store listing says.
- Where does this comparison’s data come from?
- Shoplist crawls Shopify storefronts to detect which apps each store runs, and reads each app’s Shopify App Store listing for reviews, pricing, features and integrations. Store counts are as of Nov 6, 2026 for Niblin, Feb 19, 2026 for VAL; estimated figures are labeled.
How Shoplist compares apps
Store counts come from Shoplist’s crawl of Shopify storefronts, which detects the apps each store runs; they are as of Nov 6, 2026 for Niblin, Feb 19, 2026 for VAL. Reviews, ratings, plans, features and integrations come from each app’s Shopify App Store listing. 28-day figures are labeled when estimated, and a figure that is missing or estimated never decides who leads. Read the methodology.