

Nabu: Meta & Facebook Pixel vs Pixelora: Pixel Manager
Two Shopify apps, side by side: detected stores, momentum, reviews, plans, listed features and who runs each. Store counts as of Nov 10, 2026 for Nabu, Sep 25, 2026 for Pixelora.
The short answer
- Nabu lists 22 features Pixelora’s listing doesn’t mention, including Abandoned cart, Analytics dashboard, Audience segments.
Head to head


- United States
- India
- United Kingdom
Momentum
New reviews each month
Review pace is the clearest public read on how fast an app is winning new merchants.
Explorer
- · 1 conversion API
- · Basic Analytics
- · Basic Events Tracking
- · Pixel Target Settings
- · Standard support
- · Tax / Shipping Settings
Advanced
- · 5 cAPI Integration
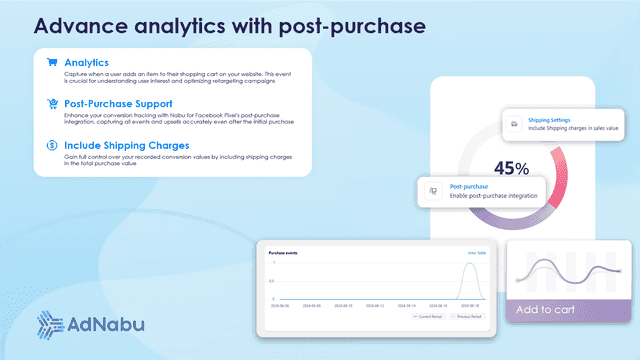
- · Advanced Analytics
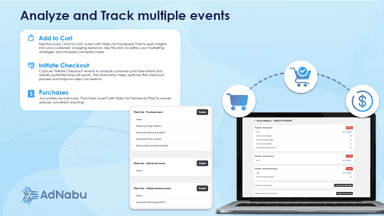
- · Advanced Events Tracking
- · Post-Purchase Tracking
- · Tax/ Shipping Settings
- · UTM parameters setting
Plus
- · 24/7 Priority Support
- · Advanced Analytics & Events Tracking
- · Content ID Parameters
- · Lookalike & Custom Audience Builder
- · Tax/ Shipping Settings
- · UTM parameters setting
Coverage counts what each App Store listing names. Every feature, checked off app by app, is in Shoplist.
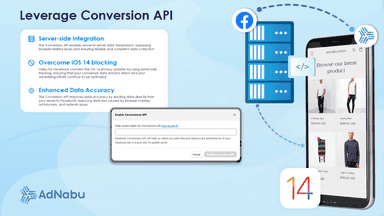
See every featureManual pixel code misses sales and breaks when themes change. Nabu installs your Facebook pixel and Instagram pixels in 1 click, with no theme edits. The Meta Conversions API sends server events past iOS 14 limits, Meta pixel deduplication counts each order once and advanced matching improves Meta event matching.
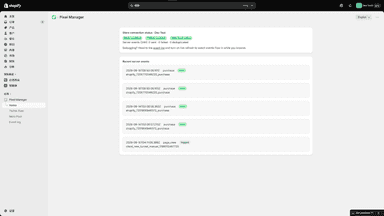
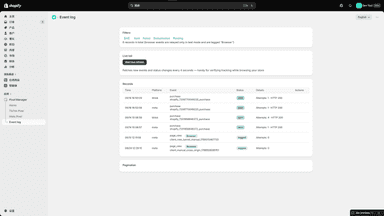
Pixelora installs ad pixels on your store without editing theme code. Storefront events fire through a managed web pixel, and purchases are also sent server-side through each platform's conversion API, with customer data hashed and duplicates removed automatically. A built-in dashboard shows product views, add-to-carts, orders, revenue, and conversion rates, so you can see which products actually sell.
- Server-side tracking for Facebook, Meta & Instagram Pixels using Conversion API
- Unlimited Facebook Pixels or Meta Pixels with Unlimited Conversion Tracking
- Bypass iOS 14 restrictions using Conversion API for accurate conversion tracking
- Analytics for all Facebook Ads events - Purchase, Add to Cart, Begin Checkout
- Install multiple ad pixels without editing theme code
- Server-side Conversions API events with automatic deduplication
- Per-product views, add-to-carts, orders, and revenue analytics




All the numbers
Every figure, side by side
A green dot marks the app ahead on a measured figure. Estimates, gaps and apps that leave no storefront trace never take the lead.
Adoption
| Measure |  Nabu |  Pixelora |
|---|---|---|
| Detected stores | 1,136 | Not published |
| Net store change, 28 days | 0 | 0 |
| Stores added, 28 days | Not enough data | Not enough data |
| Big-brand share | 9% | Not enough data |
| Top store categories | Apparel & Accessories, Health & Beauty, Home & Garden | Not published |
| Top store countries | United States, India, United Kingdom | Not published |
Reviews
| Measure | Nabu | Pixelora |
|---|---|---|
| App Store rating | 4.9 ★ | Not published |
| App Store reviews | 123 | Not published |
| New reviews, 28 days | 4 | Not enough data |
| Reviewers a year or more in | 5% | Not enough data |
FAQ
Nabu and Pixelora: common questions
- What features does each app list that the other doesn’t?
- Nabu lists 22 the others don’t mention, such as Abandoned cart, Analytics dashboard, Audience segments, Behavior. A feature missing from a listing may still be supported; this compares what each App Store listing says.
- Where does this comparison’s data come from?
- Shoplist crawls Shopify storefronts to detect which apps each store runs, and reads each app’s Shopify App Store listing for reviews, pricing, features and integrations. Store counts are as of Nov 10, 2026 for Nabu, Sep 25, 2026 for Pixelora; estimated figures are labeled.
How Shoplist compares apps
Store counts come from Shoplist’s crawl of Shopify storefronts, which detects the apps each store runs; they are as of Nov 10, 2026 for Nabu, Sep 25, 2026 for Pixelora. Reviews, ratings, plans, features and integrations come from each app’s Shopify App Store listing. 28-day figures are labeled when estimated, and a figure that is missing or estimated never decides who leads. Read the methodology.