

M8trics: Profit Analytics P&L vs TP: True Profit Analytics
Two Shopify apps, side by side: detected stores, momentum, reviews, plans, listed features and who runs each. Store counts as of Oct 13, 2026 for M8trics, Nov 6, 2026 for TP.
The short answer
- On the Shopify App Store: M8trics 5.0 from 1 reviews and TP 4.9 from 923 reviews.
- Paid plans start at $20/month for M8trics and $35/month for TP.
- TP lists 10 features M8trics’s listing doesn’t mention, including Abandoned cart, Checkout analytics, Cohort analysis.
Head to head


Profit Calculator+Profit Tracker+Profit Loss+Net Profit & COGS


- United States
- United Kingdom
- Australia
Momentum
New reviews each month
Review pace is the clearest public read on how fast an app is winning new merchants.
M8trics Unlimited
- · Custom Costs
- · Multiple stores
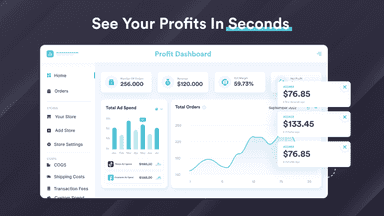
- · Real-time Profit Dashboard
- · Unlimited Shops
- · Unlimited orders per month
Basic
- · 300 orders/month
- · Custom Costs
- · Customer Lifetime Value
- · Quantity-based COGS
- · Realtime Profit Dashboard
- · Weight-based Shipping Cost
Advanced
- · 600 orders/month
- · All in Basic Plan
- · Bundling Insights
- · Customize Email Report
- · P&L Report
- · Product Analytics
Ultimate
- · 1500 orders/month
- · Ad Sync Custom Rules
- · All in Advanced Plan
- · Unlimited COGS Zones
Enterprise
- · 3500 orders/month
- · Access to all features
- · Marketing Attribution
- · Prioritized support
- · Unlimited Team members
Coverage counts what each App Store listing names. Every feature, checked off app by app, is in Shoplist.
See every featureM8trics helps you calculate the key metrics you need to grow your store. It’s simple, affordable, and efficient for all your accounting needs. Focus on what matters most so you can scale your store faster without worrying about accounting tasks. Access all your metrics in a single, easy-to-use dashboard to see what’s working and what’s not. Once you try it, you won’t look back.
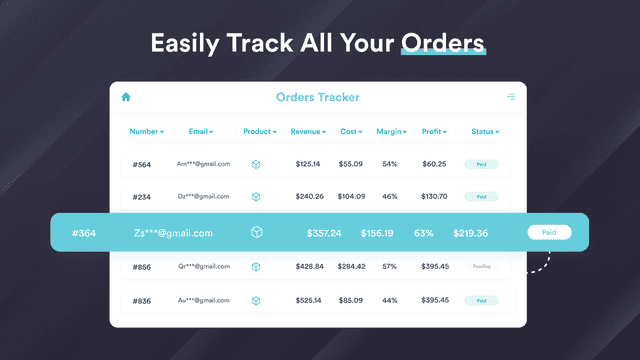
TrueProfit is a Net Profit Analytics platform that lives up to its name - showing you your store’s true profit, in real-time and on autopilot. See the big picture, with a direct focus on the ultimate metric: Net Profit. Say goodbye to outdated spreadsheets. All your data is gathered, calculated, and analyzed in one place.
- Real-Time Profit Tracking
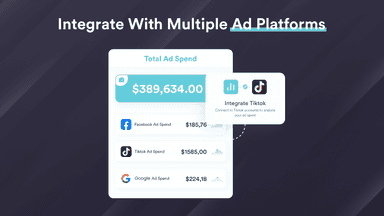
- Seamless Ad Platform Integration
- Comprehensive Performance Dashboard
- Actionable Insights
- Net Profit tracker: Know your financial health with a real-time Profit Dashboard
- Auto-track all costs: COGS, shipping cost, transaction fee, taxes, custom costs
- Real-time sync ad spends from Facebook, Google, TikTok, Bing, Snapchat, Amazon.
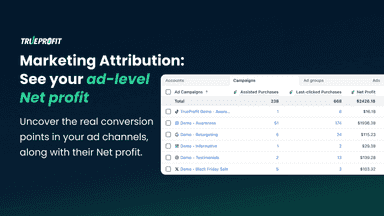
- Product Analytics & Marketing Attribution: Product-level & ad-level Net profit.



All the numbers
Every figure, side by side
A green dot marks the app ahead on a measured figure. Estimates, gaps and apps that leave no storefront trace never take the lead.
Adoption
| Measure |  M8trics |  TP |
|---|---|---|
| Detected stores | Not published | 2,147 |
| Net store change, 28 days | 0 | −15 |
| Stores added, 28 days | Not enough data | 34 |
| Big-brand share | Not enough data | 15% |
| Top store categories | Not published | Apparel & Accessories, Health & Beauty, Home & Garden |
| Top store countries | Not published | United States, United Kingdom, Australia |
Reviews
| Measure | M8trics | TP |
|---|---|---|
| App Store rating | 5.0 ★(ahead) | 4.9 ★ |
| App Store reviews | 1 | 923(ahead) |
| New reviews, 28 days | Not enough data | 14 |
| Reviewers a year or more in | Not enough data | 7% |
FAQ
M8trics and TP: common questions
- Is M8trics or TP cheaper?
- Paid plans start at $20/month for M8trics and $35/month for TP. Shoplist compares base prices only between monthly plans in the same currency; usage charges and annual plans vary, so check each plan’s limits.
- Which has better reviews, M8trics or TP?
- On the Shopify App Store: M8trics 5.0 from 1 reviews and TP 4.9 from 923 reviews.
- What features does each app list that the other doesn’t?
- M8trics lists 7 the others don’t mention, such as Activity tracking, Benchmarking, Cash flow, Income and balance. TP lists 10 the others don’t mention, such as Abandoned cart, Checkout analytics, Cohort analysis, Lifetime value (LTV). A feature missing from a listing may still be supported; this compares what each App Store listing says.
- Where does this comparison’s data come from?
- Shoplist crawls Shopify storefronts to detect which apps each store runs, and reads each app’s Shopify App Store listing for reviews, pricing, features and integrations. Store counts are as of Oct 13, 2026 for M8trics, Nov 6, 2026 for TP; estimated figures are labeled.
How Shoplist compares apps
Store counts come from Shoplist’s crawl of Shopify storefronts, which detects the apps each store runs; they are as of Oct 13, 2026 for M8trics, Nov 6, 2026 for TP. Reviews, ratings, plans, features and integrations come from each app’s Shopify App Store listing. 28-day figures are labeled when estimated, and a figure that is missing or estimated never decides who leads. Read the methodology.