

LaunchGate vs OrderLens Analytics
Two Shopify apps, side by side: detected stores, momentum, reviews, plans, listed features and who runs each. Store counts as of Oct 13, 2026.
The short answer
- OrderLens Analytics lists 2 features LaunchGate’s listing doesn’t mention, including Data export, Historical analysis.
Head to head


$29 one time fee
Basic plan access
- · Export charts as images
- · Filter data by date and category
- · Interactive charts for data analysis
- · Monitor performance in real time
- · Simple and easy to use interface
- · Track sales, orders and key metrics
Advanced analytics
- · Advanced analytics and insights
- · Advanced filters and date ranges
- · Analyze data by country and location
- · Customizable charts and dashboards
- · Detailed metrics and performance data
- · Ecommerce events and sales calendar
Coverage counts what each App Store listing names. Every feature, checked off app by app, is in Shoplist.
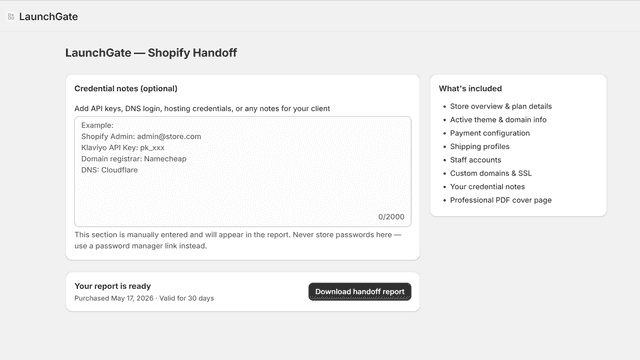
See every featureLaunchGate lets agencies and freelancers generate a professional store handoff report in one click. When a Shopify job wraps up, hand your client everything they need to know - products, themes, shipping zones, markets, orders, and more - in a clean, branded PDF. No manual copying. No missed details. Just click Generate, approve, and download your report instantly.
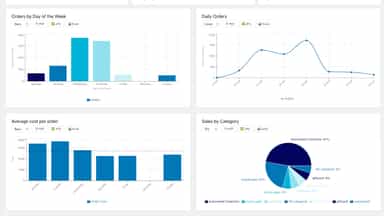
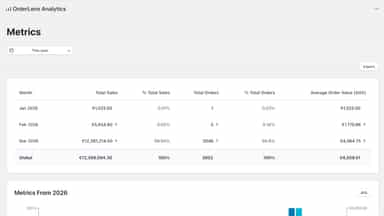
OrderLens turns your data into clear analytics, reports and visual insights. Track sales, orders, order value, and product performance with interactive charts by date, category, and location. Export reports in PDF, Excel or CSV, customize dashboards, and focus on the metrics that matter to make smarter business decisions.
- One-click PDF report covering products, themes, shipping, and orders
- Instant download — no waiting, no emails, no manual data collection
- Built for agencies and freelancers handing off completed Shopify stores
- Interactive charts to analyze sales, orders and trends by date and category
- Export reports in PDF, Excel and CSV for deeper analysis and sharing
- Custom dashboards with key metrics like AOV, top products and performance
- Explore global ecommerce events to time campaigns

All the numbers
Every figure, side by side
A green dot marks the app ahead on a measured figure. Estimates, gaps and apps that leave no storefront trace never take the lead.
Adoption
| Measure |  LaunchGate |  OrderLens Analytics |
|---|---|---|
| Detected stores | Not published | Not published |
| Net store change, 28 days | 0 | 0 |
| Stores added, 28 days | Not enough data | Not enough data |
| Big-brand share | Not enough data | Not enough data |
| Top store categories | Not published | Not published |
| Top store countries | Not published | Not published |
Reviews
| Measure | LaunchGate | OrderLens Analytics |
|---|---|---|
| App Store rating | Not published | Not published |
| App Store reviews | Not published | Not published |
| New reviews, 28 days | Not enough data | Not enough data |
| Reviewers a year or more in | Not enough data | Not enough data |
Pricing
| Measure | LaunchGate | OrderLens Analytics |
|---|---|---|
| Free plan | Not listed | Not listed |
| Lowest paid monthly plan | No monthly plan listed | $19/month |
| Longest free trial | Not listed | 7 days |
| Plans listed | 1 | 2 |
Listing
| Measure | LaunchGate | OrderLens Analytics |
|---|---|---|
| Shopify category rank | #1529 | Not enough data |
| Shopify App Charts | Not on this week’s charts | Not on this week’s charts |
| Built for Shopify | No | No |
| Launched | May 21, 2026 | May 7, 2026 |
| Languages | 1 | 2 |
| Developer | 360 Advisors | Orizontic |
FAQ
LaunchGate and OrderLens Analytics: common questions
- What features does each app list that the other doesn’t?
- OrderLens Analytics lists 2 the others don’t mention, such as Data export, Historical analysis. A feature missing from a listing may still be supported; this compares what each App Store listing says.
- Where does this comparison’s data come from?
- Shoplist crawls Shopify storefronts to detect which apps each store runs, and reads each app’s Shopify App Store listing for reviews, pricing, features and integrations. Store counts are as of Oct 13, 2026; estimated figures are labeled.
How Shoplist compares apps
Store counts come from Shoplist’s crawl of Shopify storefronts, which detects the apps each store runs; they are as of Oct 13, 2026. Reviews, ratings, plans, features and integrations come from each app’s Shopify App Store listing. 28-day figures are labeled when estimated, and a figure that is missing or estimated never decides who leads. Read the methodology.