
Kleio Analytics vs Rentabilia
Two Shopify apps, side by side: detected stores, momentum, reviews, plans, listed features and who runs each. Store counts as of Oct 14, 2026 for Kleio Analytics, Nov 19, 2026 for Rentabilia.
The short answer
- Only Rentabilia lists a free plan. Paid plans start at $29/month for Kleio Analytics and $70/month for Rentabilia.
- Kleio Analytics lists 8 features Rentabilia’s listing doesn’t mention, including Cohort analysis, Lifetime value (LTV), Multi-store reports.
Head to head

Momentum
New reviews each month
Review pace is the clearest public read on how fast an app is winning new merchants.
Everything
- · 14-day free trial
- · All features
- · Unlimited orders
- · Unlimited revenue
- · Unlimited users
Gratis
- · Calculadora VAN, TIR y payback
- · Coste y margen de 25 productos
- · Punto muerto de los últimos 30 días
- · Ventas reales con IPC
- · Ventas, Gini, Lorenz y ABC
Pro
- · Escandallo manual y carga por CSV
- · Matriz 12×12 y 200 escenarios
- · Previsión estacional a 3 meses
- · Punto muerto 90/365 días y simulador
- · Todos los productos y 5 años de datos
Coverage counts what each App Store listing names. Every feature, checked off app by app, is in Shoplist.
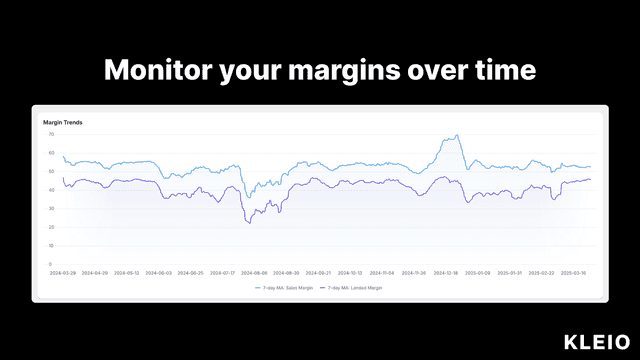
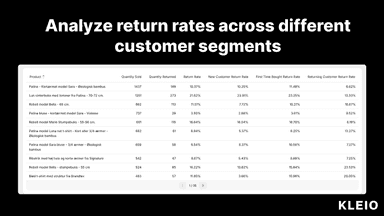
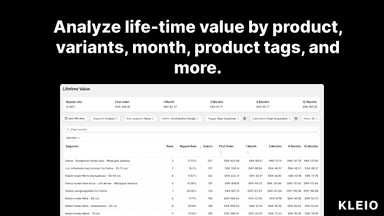
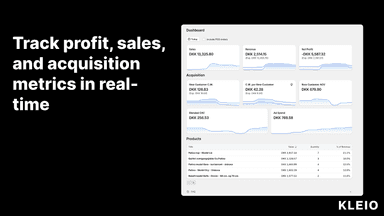
See every featureHey, Mathias here (the founder). I was frustrated by other analytics tools and found them too expensive, so I built the analytics toolbox I've always dreamed of. Track your favorite metrics in the dashboard; connect ad channels and track your acquisition; break down your P&L to find what’s eating your margin; rank products by the profit and LTV they create; monitor inventory and get help merchandising; and much more.
Rentabilia ayuda a tiendas pequeñas a decidir con números. Calcula el coste de producción y el margen de cada producto y variante, y el punto muerto y el margen de seguridad de la tienda. Analiza ventas con descriptivos, Gini, Lorenz y ABC; prevé tendencia y estacionalidad; deflacta ventas con el IPC de España; y valora decisiones con VAN, TIR, payback y matrices (VME, Wald, Laplace, Hurwicz, Savage).
- Dashboard: Monitor your sales, profits, and customer acquisition in real time.
- Lifetime value analysis: Which products drive the most profits over time?
- Margin Analysis: What's your true margins after shipping, refunds and discounts?
- Returns Analysis: Do you have any problematic products that are often returned?
- Descriptivos de ventas por producto, Gini, curva de Lorenz y análisis ABC.
- Previsión con tendencia OLS, medias móviles e índices estacionales.
- Ventas deflactadas con el IPC de España para comparar en términos reales.
- Calculadora de VAN, TIR y payback para valorar compras e inversiones.
All the numbers
Every figure, side by side
A green dot marks the app ahead on a measured figure. Estimates, gaps and apps that leave no storefront trace never take the lead.
Adoption
| Measure |  Kleio Analytics | |
|---|---|---|
| Detected stores | Not published | Not published |
| Net store change, 28 days | 0 | 0 |
| Stores added, 28 days | Not enough data | Not enough data |
| Big-brand share | Not enough data | Not enough data |
| Top store categories | Not published | Not published |
| Top store countries | Not published | Not published |
Reviews
| Measure | Kleio Analytics | |
|---|---|---|
| App Store rating | 5.0 ★ | Not published |
| App Store reviews | 20 | Not published |
| New reviews, 28 days | 0 | Not enough data |
| Reviewers a year or more in | Not enough data | Not enough data |
Pricing
| Measure | Kleio Analytics | |
|---|---|---|
| Free plan | Not listed | Yes |
| Lowest paid monthly plan | $29/month(ahead) | $70/month |
| Longest free trial | 14 days | 14 days |
| Plans listed | 1 | 2 |
Listing
| Measure | Kleio Analytics | |
|---|---|---|
| Shopify category rank | #53 | Not enough data |
| Shopify App Charts | Not on this week’s charts | Not on this week’s charts |
| Built for Shopify | No | No |
| Launched | Feb 19, 2025 | Nov 17, 2026 |
| Languages | 1 | 2 |
| Developer | Kleio | GyB |
FAQ
Kleio Analytics and Rentabilia: common questions
- Is Kleio Analytics or Rentabilia cheaper?
- Only Rentabilia lists a free plan. Paid plans start at $29/month for Kleio Analytics and $70/month for Rentabilia. Shoplist compares base prices only between monthly plans in the same currency; usage charges and annual plans vary, so check each plan’s limits.
- What features does each app list that the other doesn’t?
- Kleio Analytics lists 8 the others don’t mention, such as Cohort analysis, Lifetime value (LTV), Multi-store reports, Profit insights. Rentabilia lists 1 the others don’t mention, such as Forecasting. A feature missing from a listing may still be supported; this compares what each App Store listing says.
- Where does this comparison’s data come from?
- Shoplist crawls Shopify storefronts to detect which apps each store runs, and reads each app’s Shopify App Store listing for reviews, pricing, features and integrations. Store counts are as of Oct 14, 2026 for Kleio Analytics, Nov 19, 2026 for Rentabilia; estimated figures are labeled.
How Shoplist compares apps
Store counts come from Shoplist’s crawl of Shopify storefronts, which detects the apps each store runs; they are as of Oct 14, 2026 for Kleio Analytics, Nov 19, 2026 for Rentabilia. Reviews, ratings, plans, features and integrations come from each app’s Shopify App Store listing. 28-day figures are labeled when estimated, and a figure that is missing or estimated never decides who leads. Read the methodology.