
Kipify AI KPI Profit Dashboard vs KPIHelm: AI Ads Analytics
Two Shopify apps, side by side: detected stores, momentum, reviews, plans, listed features and who runs each. Store counts as of Oct 14, 2026 for Kipify AI KPI Profit Dashboard, Nov 7, 2026 for KPIHelm.
The short answer
- Only Kipify AI KPI Profit Dashboard lists a free plan. Paid plans start at $29/month for Kipify AI KPI Profit Dashboard and $19.99/month for KPIHelm.
- Kipify AI KPI Profit Dashboard lists 2 features KPIHelm’s listing doesn’t mention, including Forecasting, Marketing attribution.
Head to head


Momentum
New reviews each month
Review pace is the clearest public read on how fast an app is winning new merchants.
Free
- · 1 user
- · 20 AI calls/month included
- · 90 days historical data lookback
- · All connectors enabled
- · Custom reports
- · Inventory tool
Starter: 1 user
- · 1 user included
- · 12 months historical data lookback
- · 500 AI calls/month included
- · All connectors enabled
- · Custom reports
- · Inventory tool
Pro
- · 1,500 AI calls/month included
- · 24 months historical data lookback
- · All connectors enabled
- · Custom reports
- · Inventory tool
- · KPI Dashboard
Advanced
- · 5,000 AI calls/month included
- · All connectors enabled
- · Custom reports
- · Early access to new features
- · Inventory tool
- · KPI Dashboard
Growth 2*4
- · 1 free report before you subscribe
- · Action plan (short to long term)
- · Benchmark vs your segment
- · Clear "fix this first" priority
- · Each ad platform judged on its own
- · Find the broken step in your funnel
Growth 4*4
- · 1 free report before you subscribe
- · Action plan (short to long term)
- · Benchmark vs your segment
- · Clear "fix this first" priority
- · Each ad platform judged on its own
- · Find the broken step in your funnel
SUYLA
- · A full AI review weekly, per platform
- · A report every morning, per platform
- · Advice, not autopilot — you decide
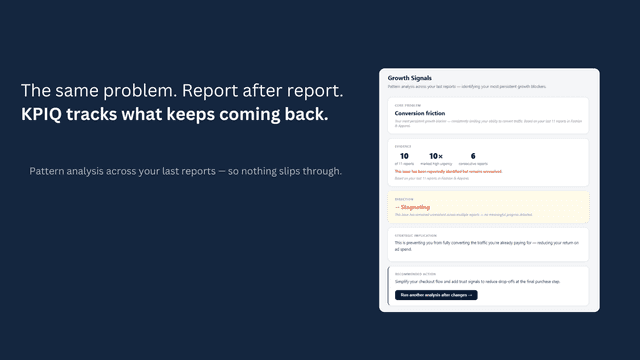
- · Flags issues that keep coming back
- · Snooze or mute anything
- · Spots platforms that stop counting sales
Coverage counts what each App Store listing names. Every feature, checked off app by app, is in Shoplist.
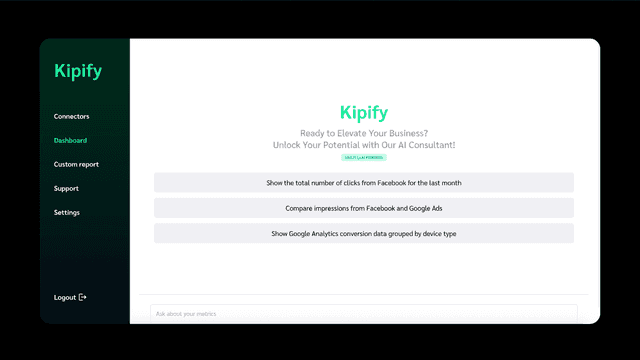
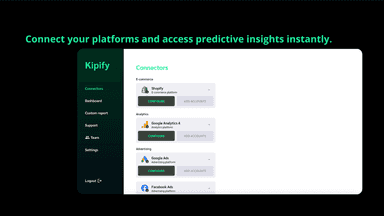
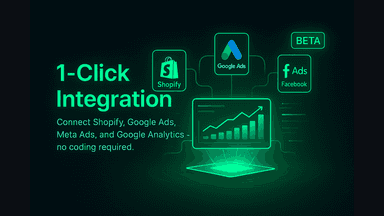
See every featureWhen fragmented ad, sales and inventory data hide profit leaks, you waste spend. Kipify unifies Shopify, Google Ads, Meta Ads, and GA4 in one KPI dashboard. See MER, blended ROAS, ACOS, margins, and stock cover on one screen. Get custom reports and an AI analyst that flags wasted spend, margin leaks, and low-stock risks. Also connect Claude or ChatGPT via Kipify MCP (beta) to ask about the same profit data.
Connect TikTok, Meta or Google Ads, or enter your numbers by hand. KPIHelm judges each platform on its own against your segment's benchmarks and shows which step is breaking and what to fix first. Add your margin to see, in money, what your ads must return to break even. On SUYLA it checks each morning, including whether each platform still counts your sales.
- AI personal assistance for report and insight
- Custom Reports Builder: Create personalized report and custom metrics
- Multi-Platform Integration: Connect Google Ads, Facebook Ads, Google Analytics
- See where your performance breaks down
- Spot hidden issues across your funnel
- Identify your highest-impact opportunity
- Get a clear, prioritized action roadmap



All the numbers
Every figure, side by side
A green dot marks the app ahead on a measured figure. Estimates, gaps and apps that leave no storefront trace never take the lead.
Adoption
| Measure |  Kipify AI KPI Profit Dashboard |  KPIHelm |
|---|---|---|
| Detected stores | Not published | Not published |
| Net store change, 28 days | 0 | 0 |
| Stores added, 28 days | Not enough data | Not enough data |
| Big-brand share | Not enough data | Not enough data |
| Top store categories | Not published | Not published |
| Top store countries | Not published | Not published |
Reviews
| Measure | Kipify AI KPI Profit Dashboard | KPIHelm |
|---|---|---|
| App Store rating | 5.0 ★ | Not published |
| App Store reviews | 2 | Not published |
| New reviews, 28 days | Not enough data | Not enough data |
| Reviewers a year or more in | Not enough data | Not enough data |
Pricing
| Measure | Kipify AI KPI Profit Dashboard | KPIHelm |
|---|---|---|
| Free plan | Yes | Not listed |
| Lowest paid monthly plan | $29/month | $19.99/month(ahead) |
| Longest free trial | 14 days | 15 days |
| Plans listed | 4 | 3 |
Listing
| Measure | Kipify AI KPI Profit Dashboard | KPIHelm |
|---|---|---|
| Shopify category rank | #158 | #781 |
| Shopify App Charts | Not on this week’s charts | Not on this week’s charts |
| Built for Shopify | No | No |
| Launched | Oct 20, 2025 | May 19, 2026 |
| Languages | 1 | 4 |
| Developer | Kipify | Alter Günes |
FAQ
Kipify AI KPI Profit Dashboard and KPIHelm: common questions
- Is Kipify AI KPI Profit Dashboard or KPIHelm cheaper?
- Only Kipify AI KPI Profit Dashboard lists a free plan. Paid plans start at $29/month for Kipify AI KPI Profit Dashboard and $19.99/month for KPIHelm. Shoplist compares base prices only between monthly plans in the same currency; usage charges and annual plans vary, so check each plan’s limits.
- What features does each app list that the other doesn’t?
- Kipify AI KPI Profit Dashboard lists 2 the others don’t mention, such as Forecasting, Marketing attribution. KPIHelm lists 1 the others don’t mention, such as Benchmarking. A feature missing from a listing may still be supported; this compares what each App Store listing says.
- Where does this comparison’s data come from?
- Shoplist crawls Shopify storefronts to detect which apps each store runs, and reads each app’s Shopify App Store listing for reviews, pricing, features and integrations. Store counts are as of Oct 14, 2026 for Kipify AI KPI Profit Dashboard, Nov 7, 2026 for KPIHelm; estimated figures are labeled.
How Shoplist compares apps
Store counts come from Shoplist’s crawl of Shopify storefronts, which detects the apps each store runs; they are as of Oct 14, 2026 for Kipify AI KPI Profit Dashboard, Nov 7, 2026 for KPIHelm. Reviews, ratings, plans, features and integrations come from each app’s Shopify App Store listing. 28-day figures are labeled when estimated, and a figure that is missing or estimated never decides who leads. Read the methodology.