

Kensa Reports & Insights vs PayHelm: Analytics & Reports
Two Shopify apps, side by side: detected stores, momentum, reviews, plans, listed features and who runs each. Store counts as of Nov 6, 2026 for Kensa Reports & Insights, Oct 13, 2026 for PayHelm.
The short answer
- On the Shopify App Store: Kensa Reports & Insights 5.0 from 2 reviews and PayHelm 5.0 from 6 reviews.
- Only PayHelm lists a free plan. Paid plans start at $29/month for Kensa Reports & Insights and $20/month for PayHelm.
- PayHelm lists 26 features Kensa Reports & Insights’s listing doesn’t mention, including Abandoned cart, AI insights, Benchmarking.
Head to head


Accounting for sales, orders, inventory, tax, profits, & more.
Momentum
New reviews each month
Review pace is the clearest public read on how fast an app is winning new merchants.
Founding Member
- · Automatic 60-day sync on first-install
- · CSV exports
- · Customer cohort retention
- · Daily sales & top products
- · Product costs auto-pulled
- · Real-time margin trends & goal tracking
Free
- · 12-month data lookback
- · Fulfillment & shipping analytics
- · Import all sales history
- · Orders, refunds & revenue reports
- · Profit & margin reports
- · Top SKUs & product performance
Entrepreneur
- · 1 User + 1 store + marketing channels
- · 100 AI Credits per month
- · 300+ metrics & customer segments
- · AI Chat for reports & tool management
- · Import your entire sales history
- · Powerful ecommerce analytics dashboard
Business
- · 1,000 AI credits per month
- · 5 year historical look back
- · Advanced filters & segments
- · Connect unlimited stores & integrations
- · Everything in Entrepreneur, plus:
- · Google Analytics integration
Coverage counts what each App Store listing names. Every feature, checked off app by app, is in Shoplist.
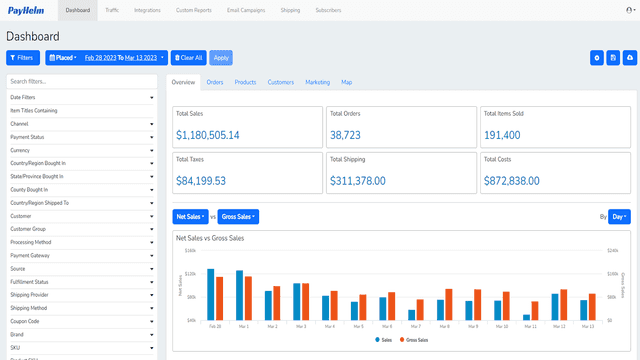
See every featureKensa Reports & Insights gives you real profit after costs, margin trends, and a clear view of which customers keep coming back — all built in, ready the moment you install. Track revenue and profit goals over time, see margin trends at a glance, and understand repeat-purchase rates, cohort retention, and reorder timing, with CSV export throughout. No dashboards to build, no filters to configure.
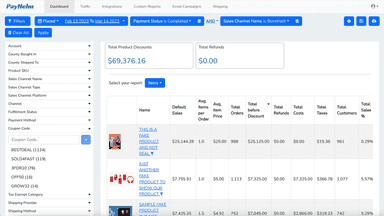
Connect all your sources of data together to understand how to grow your profit. Analyze multiple stores, marketing channels, and more like Amazon, Etsy and more. See how your Google Ads or Facebook Ads are performing on ROAS. Analyze your UPS labels or ShipStation costs. Connect your Stripe, Braintree, or PayPal accounts so you can analyze gateway fees and understand Gross Margin % or Profit.
- See true profit after costs, with margin trends and goal tracking
- Understand repeat-purchase rates, cohort retention, and reorder timing
- Daily sales trends, top products, and channel breakdowns, instantly
- Get an in-app alert the moment your margin drops below threshold
- Unlock your data and access mission critical information to grow your business.
- Export your date and integrate it with other mission critical services.
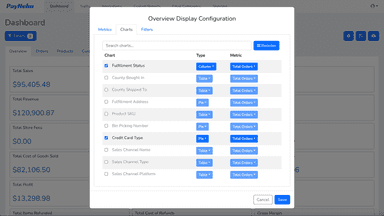
- Analyze your business, products, customers, and get your team on the same page.
- Share and export your reports to PDF, Excel, CSV, Google Sheets.



All the numbers
Every figure, side by side
A green dot marks the app ahead on a measured figure. Estimates, gaps and apps that leave no storefront trace never take the lead.
Adoption
| Measure |  Kensa Reports & Insights |  PayHelm |
|---|---|---|
| Detected stores | Not published | Not published |
| Net store change, 28 days | 0 | 0 |
| Stores added, 28 days | Not enough data | Not enough data |
| Big-brand share | Not enough data | Not enough data |
| Top store categories | Not published | Not published |
| Top store countries | Not published | Not published |
Reviews
| Measure | Kensa Reports & Insights | PayHelm |
|---|---|---|
| App Store rating | 5.0 ★ | 5.0 ★ |
| App Store reviews | 2 | 6(ahead) |
| New reviews, 28 days | Not enough data | 0 |
| Reviewers a year or more in | Not enough data | Not enough data |
Pricing
| Measure | Kensa Reports & Insights | PayHelm |
|---|---|---|
| Free plan | Not listed | Yes |
| Lowest paid monthly plan | $29/month | $20/month(ahead) |
| Longest free trial | 14 days | 14 days |
| Plans listed | 1 | 3 |
Listing
| Measure | Kensa Reports & Insights | PayHelm |
|---|---|---|
| Shopify category rank | #437 | #421(ahead) |
| Shopify App Charts | Not on this week’s charts | Not on this week’s charts |
| Built for Shopify | No | No |
| Launched | Sep 4, 2026 | Aug 20, 2019 |
| Languages | 1 | 1 |
| Developer | KensaWorks | PayHelm |
FAQ
Kensa Reports & Insights and PayHelm: common questions
- Is Kensa Reports & Insights or PayHelm cheaper?
- Only PayHelm lists a free plan. Paid plans start at $29/month for Kensa Reports & Insights and $20/month for PayHelm. Shoplist compares base prices only between monthly plans in the same currency; usage charges and annual plans vary, so check each plan’s limits.
- Which has better reviews, Kensa Reports & Insights or PayHelm?
- On the Shopify App Store: Kensa Reports & Insights 5.0 from 2 reviews and PayHelm 5.0 from 6 reviews.
- What features does each app list that the other doesn’t?
- Kensa Reports & Insights lists 3 the others don’t mention, such as Cohort analysis, Forecasting, Heatmaps. PayHelm lists 26 the others don’t mention, such as Abandoned cart, AI insights, Benchmarking, Checkout analytics. A feature missing from a listing may still be supported; this compares what each App Store listing says.
- Where does this comparison’s data come from?
- Shoplist crawls Shopify storefronts to detect which apps each store runs, and reads each app’s Shopify App Store listing for reviews, pricing, features and integrations. Store counts are as of Nov 6, 2026 for Kensa Reports & Insights, Oct 13, 2026 for PayHelm; estimated figures are labeled.
How Shoplist compares apps
Store counts come from Shoplist’s crawl of Shopify storefronts, which detects the apps each store runs; they are as of Nov 6, 2026 for Kensa Reports & Insights, Oct 13, 2026 for PayHelm. Reviews, ratings, plans, features and integrations come from each app’s Shopify App Store listing. 28-day figures are labeled when estimated, and a figure that is missing or estimated never decides who leads. Read the methodology.