
Inventory IQ vs Viking Warehouse Stock BI
Two Shopify apps, side by side: detected stores, momentum, reviews, plans, listed features and who runs each. Store counts as of Oct 14, 2026.
The short answer
- Only Inventory IQ lists a free plan. Paid plans start at $19/month for Inventory IQ and $49/month for Viking Warehouse Stock BI.
- Viking Warehouse Stock BI lists 5 features Inventory IQ’s listing doesn’t mention, including AI optimization, Custom reports, Email notifications.
Head to head


free
- · Dead stock report with capital tied up
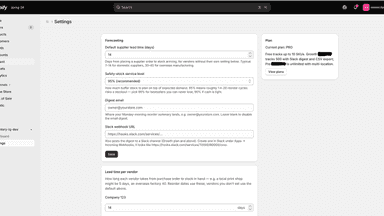
- · Per-vendor supplier lead times
- · Reorder quantities and order-by dates
- · Stockout date forecast for every SKU
- · Up to 10 tracked SKUs
- · Weekly email digest
Growth
- · Everything in Free
- · Forecasts re-tuned nightly to your store
- · Purchase order CSV export per vendor
- · Slack digest for your team
- · Up to 500 tracked SKUs
Pro
- · Everything in Growth
- · Priority sync — your data goes first
- · Stock views per location
- · Unlimited tracked SKUs
Professional
Coverage counts what each App Store listing names. Every feature, checked off app by app, is in Shoplist.
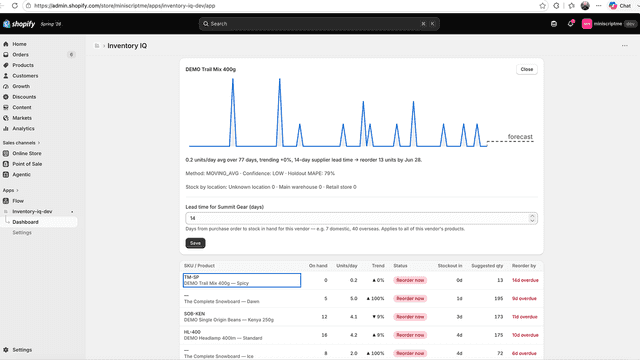
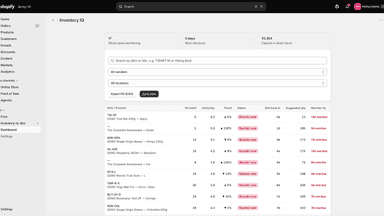
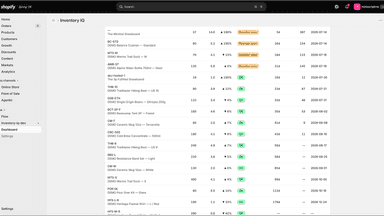
See every featureInventory IQ answers one question: what do you need to reorder, how much, and by when. It syncs your catalogue and sales history, then forecasts when each SKU will run out based on your sales velocity, trends, and weekly patterns. Every forecast explains its reasoning in plain language and adjusts to your supplier lead times.
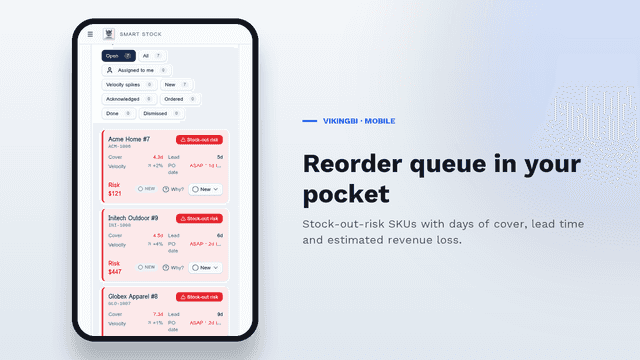
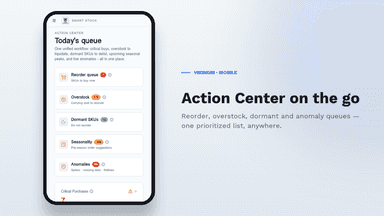
Viking Warehouse Stock BI optimizes warehouse inventory levels by converting sales patterns into actionable replenishment insights. The app tracks sales velocity across Shopify and external channels to forecast demand. By pairing current stock levels with supplier lead times, it determines optimal reorder thresholds to prevent stockouts and reduce overstock.
- Stockout date forecast for every SKU by analysing order history.
- Suggested reorder quantities and order-by dates & sync with orders and inventory
- Per-vendor supplier lead times and safety stock levels & Stocks per location.
- Dead stock report with capital tied up
- Dynamic days-of-cover analysis updated from live inventory snapshots.
- Revenue-loss forecasting for SKUs at risk of going out of stock.
- Monthly carrying-cost estimator to surface dead-stock capital drain.
- Yearly demand-peak detection from 12+ months of historical data.


All the numbers
Every figure, side by side
A green dot marks the app ahead on a measured figure. Estimates, gaps and apps that leave no storefront trace never take the lead.
Adoption
| Measure |  Inventory IQ |  Viking Warehouse Stock BI |
|---|---|---|
| Detected stores | Not published | Not published |
| Net store change, 28 days | 0 | 0 |
| Stores added, 28 days | Not enough data | Not enough data |
| Big-brand share | Not enough data | Not enough data |
| Top store categories | Not published | Not published |
| Top store countries | Not published | Not published |
Reviews
| Measure | Inventory IQ | Viking Warehouse Stock BI |
|---|---|---|
| App Store rating | Not published | Not published |
| App Store reviews | Not published | Not published |
| New reviews, 28 days | Not enough data | Not enough data |
| Reviewers a year or more in | Not enough data | Not enough data |
Pricing
| Measure | Inventory IQ | Viking Warehouse Stock BI |
|---|---|---|
| Free plan | Yes | Not listed |
| Lowest paid monthly plan | $19/month(ahead) | $49/month |
| Longest free trial | 14 days | 7 days |
| Plans listed | 3 | 1 |
Listing
| Measure | Inventory IQ | Viking Warehouse Stock BI |
|---|---|---|
| Shopify category rank | #637 | #614(ahead) |
| Shopify App Charts | Not on this week’s charts | Not on this week’s charts |
| Built for Shopify | No | No |
| Launched | Jul 17, 2026 | May 27, 2026 |
| Languages | 1 | 1 |
| Developer | Miniscript Labs | VikingC ApS |
FAQ
Inventory IQ and Viking Warehouse Stock BI: common questions
- Is Inventory IQ or Viking Warehouse Stock BI cheaper?
- Only Inventory IQ lists a free plan. Paid plans start at $19/month for Inventory IQ and $49/month for Viking Warehouse Stock BI. Shoplist compares base prices only between monthly plans in the same currency; usage charges and annual plans vary, so check each plan’s limits.
- What features does each app list that the other doesn’t?
- Inventory IQ lists 4 the others don’t mention, such as Inventory tracking, Out of stock notifications, Replenishment reminders, Stock replenishment. Viking Warehouse Stock BI lists 5 the others don’t mention, such as AI optimization, Custom reports, Email notifications, Multi-channel. A feature missing from a listing may still be supported; this compares what each App Store listing says.
- Where does this comparison’s data come from?
- Shoplist crawls Shopify storefronts to detect which apps each store runs, and reads each app’s Shopify App Store listing for reviews, pricing, features and integrations. Store counts are as of Oct 14, 2026; estimated figures are labeled.
How Shoplist compares apps
Store counts come from Shoplist’s crawl of Shopify storefronts, which detects the apps each store runs; they are as of Oct 14, 2026. Reviews, ratings, plans, features and integrations come from each app’s Shopify App Store listing. 28-day figures are labeled when estimated, and a figure that is missing or estimated never decides who leads. Read the methodology.