
HueMetrics vs Portfolytics ‑ Collection data
Two Shopify apps, side by side: detected stores, momentum, reviews, plans, listed features and who runs each. Store counts as of Oct 13, 2026.
The short answer
- Only HueMetrics lists a free plan. Paid plans start at $29/month for HueMetrics and $3/month for Portfolytics.
- HueMetrics lists 5 features Portfolytics’s listing doesn’t mention, including Benchmarking, Forecasting, Heatmaps.
Head to head


Free Plan
- · Catalog color distribution
- · Catalog scan with auto color detection
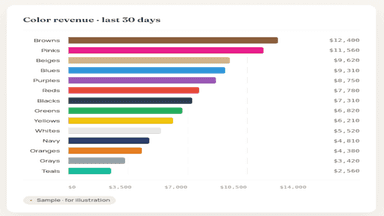
- · Color Revenue Rankings
- · Instant color audit and diversity score
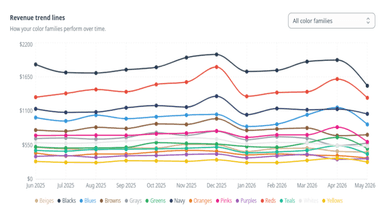
- · Revenue Trend Lines
- · Revenue comparison with last month
Pro Plan
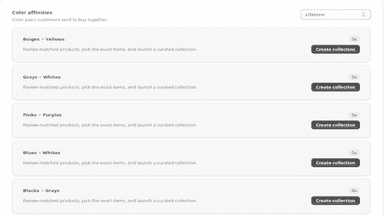
- · Color Affinities
- · Color × product type heat map
- · Industry Benchmarks (Coming Soon)
- · Momentum Map
- · One-click collection & discount creation
- · Returns by color and discount dependence
Shopify Basic
- · Absolutely no setup needed
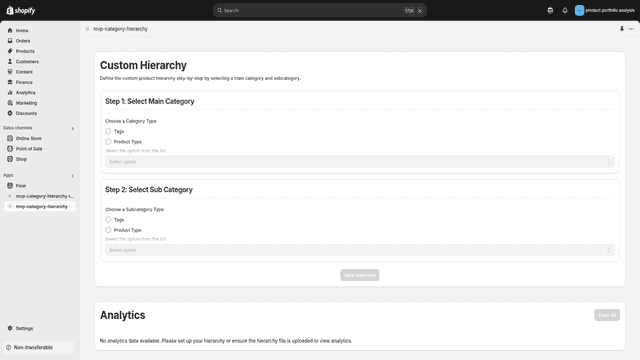
- · Automatic product hierarchy
- · Built-in no-setup visual dashboards
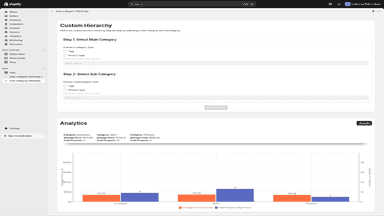
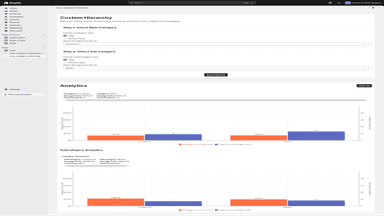
- · Collection & category analytics
- · Customer support + free onboarding
- · Detailed product sales info per category
Shopify Grow
- · Absolutely no setup needed
- · Automatic product hierarchy
- · Built-in no-setup visual dashboards
- · Collection & category analytics
- · Customer support + free onboarding
- · Detailed product sales info per category
Shopify Advanced
- · Absolutely no setup needed
- · Automatic product hierarchy
- · Built-in no-setup visual dashboards
- · Collection & category analytics
- · Customer support + free onboarding
- · Detailed product sales info per category
Shopify Plus
- · Absolutely no setup needed
- · Automatic product hierarchy
- · Built-in no-setup visual dashboards
- · Collection & category analytics
- · Customer support + premium onboarding
- · Detailed product sales info per category
Coverage counts what each App Store listing names. Every feature, checked off app by app, is in Shoplist.
See every featureSee which colors make you money. HueMetrics ranks every color in your store by the revenue it brings in, shows which colors are slowing down and deserve a markdown, and which pairs sell together. Fix a wrong color with one click. Turn a winner into a collection or a laggard into a discount without leaving Shopify, and approve the products before anything goes live.
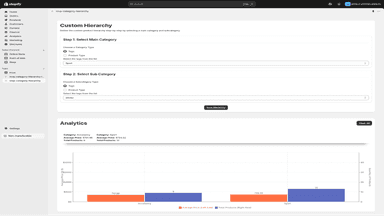
Imagine if you could instantly see which collections sell and which don't. Promote the ones that do well and increase ROAS and CRV. Automatic product hierarchy helps spotting winners and underperformers. Move between main and subcategories with a single click, spot opportunities and increase profits. Get analytics previously available only to the biggest stores. Built to save you time and make analytics simple.
- Revenue analysis by color
- Industry benchmarks
- At-risk colors/product detection
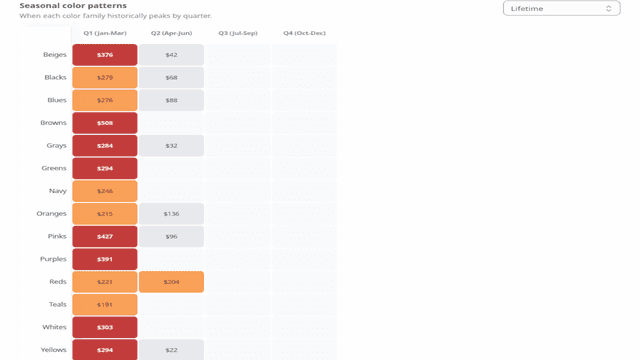
- Color affinity: Discover which color pairs customers tend to buy together
- Number of collections and products. How many of them had sales
- For every collection or category: unique product count, sales and more
- Category sales match the store product sales. No overlaps
- Product hierarchy automatically mirrored from main menu
All the numbers
Every figure, side by side
A green dot marks the app ahead on a measured figure. Estimates, gaps and apps that leave no storefront trace never take the lead.
Adoption
| Measure |  HueMetrics |  Portfolytics |
|---|---|---|
| Detected stores | Not published | Not published |
| Net store change, 28 days | 0 | 0 |
| Stores added, 28 days | Not enough data | Not enough data |
| Big-brand share | Not enough data | Not enough data |
| Top store categories | Not published | Not published |
| Top store countries | Not published | Not published |
Reviews
| Measure | HueMetrics | Portfolytics |
|---|---|---|
| App Store rating | Not published | Not published |
| App Store reviews | Not published | Not published |
| New reviews, 28 days | Not enough data | Not enough data |
| Reviewers a year or more in | Not enough data | Not enough data |
Pricing
| Measure | HueMetrics | Portfolytics |
|---|---|---|
| Free plan | Yes | Not listed |
| Lowest paid monthly plan | $29/month | $3/month(ahead) |
| Longest free trial | Not listed | 14 days |
| Plans listed | 2 | 4 |
Listing
| Measure | HueMetrics | Portfolytics |
|---|---|---|
| Shopify category rank | #1507 | #1186(ahead) |
| Shopify App Charts | Not on this week’s charts | Not on this week’s charts |
| Built for Shopify | No | No |
| Launched | Jun 1, 2026 | Feb 3, 2025 |
| Languages | 1 | 1 |
| Developer | HueMetrics | Ville Laukkanen |
FAQ
HueMetrics and Portfolytics: common questions
- Is HueMetrics or Portfolytics cheaper?
- Only HueMetrics lists a free plan. Paid plans start at $29/month for HueMetrics and $3/month for Portfolytics. Shoplist compares base prices only between monthly plans in the same currency; usage charges and annual plans vary, so check each plan’s limits.
- What features does each app list that the other doesn’t?
- HueMetrics lists 5 the others don’t mention, such as Benchmarking, Forecasting, Heatmaps, Notifications. Portfolytics lists 2 the others don’t mention, such as Custom dashboards, Profit insights. A feature missing from a listing may still be supported; this compares what each App Store listing says.
- Where does this comparison’s data come from?
- Shoplist crawls Shopify storefronts to detect which apps each store runs, and reads each app’s Shopify App Store listing for reviews, pricing, features and integrations. Store counts are as of Oct 13, 2026; estimated figures are labeled.
How Shoplist compares apps
Store counts come from Shoplist’s crawl of Shopify storefronts, which detects the apps each store runs; they are as of Oct 13, 2026. Reviews, ratings, plans, features and integrations come from each app’s Shopify App Store listing. 28-day figures are labeled when estimated, and a figure that is missing or estimated never decides who leads. Read the methodology.