

Heatmap and User Journey vs WEB‑STAT: Live Web Analytics
Two Shopify apps, side by side: detected stores, momentum, reviews, plans, listed features and who runs each. Store counts as of Oct 14, 2026 for Heatmap and User Journey, Nov 3, 2026 for WEB‑STAT.
The short answer
- On the Shopify App Store: Heatmap and User Journey 5.0 from 1 reviews and WEB‑STAT 5.0 from 12 reviews.
- Only WEB‑STAT lists a free plan. Paid plans start at $1/month for Heatmap and User Journey and $4.95/month for WEB‑STAT.
- WEB‑STAT lists 11 features Heatmap and User Journey’s listing doesn’t mention, including Cohort analysis, Custom dashboards, Custom reports.
Head to head


Professional traffic analysis for your shop. Live data.


- United States
- United Kingdom
- Australia
Momentum
New reviews each month
Review pace is the clearest public read on how fast an app is winning new merchants.
Free
Free
- · 14-day Pro preview, then Free
- · Devices and browsers used
- · Latest 50 visits: detailed log & map
- · New vs. repeat visitor
- · Traffic sources and entry pages
- · Traffic summaries for all visits
Basic
- · 6 months of aggregated report history
- · Everything in Free, plus:
- · Exclude your own visits
- · Latest 100 visits: detailed log & map
- · Traffic source and referrer reports
- · Up to 10,000 page views/month
Plus
- · 1 year of aggregated report history
- · Bounce-rate reports
- · Everything in Basic, plus:
- · Latest 1,000 visits: detailed log & map
- · Time-on-site reports
- · Up to 100,000 page views per month
Pro
- · 2 years of aggregated report history
- · Archive details of all visits
- · Downtime alerts
- · Everything in Plus, plus:
- · Label and recognize visitors
- · Latest 2,000 visits: detailed log & map
Max
- · 5 years of aggregated report history
- · Daily aggregation for all reports
- · Everything in Pro, plus:
- · Latest 5,000 visits: detailed log & map
- · Up to 500,000 page views per month
Coverage counts what each App Store listing names. Every feature, checked off app by app, is in Shoplist.
See every featureTrack and visualize user behavior to understand how customers interact with your store. Our app captures real-time data like page visits, clicks, mouse movements, and time spent. Merchants can explore journey flows and heatmaps to identify engagement zones and optimize layouts. With seamless integration and no setup needed, data collection starts instantly after install.
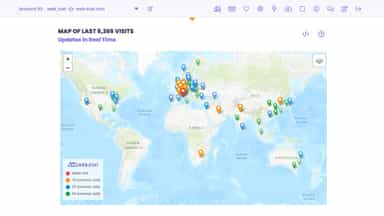
Watch store activity as it happens. See where visitors come from, the pages they view, how long they stay, and the paths they take. Track traffic sources, campaigns, conversions, bounce rates, and locations through clear reports and maps. Filter your own visits, schedule alerts and email reports, and export or share results. Setup takes minutes: enable the theme app embed without editing code.
- Real-time tracking of user clicks, page visits, and mouse movements.
- Visual heatmaps to see frequent engagement zones on desktop and mobile
- User journey flow to understand customer navigation paths clearly
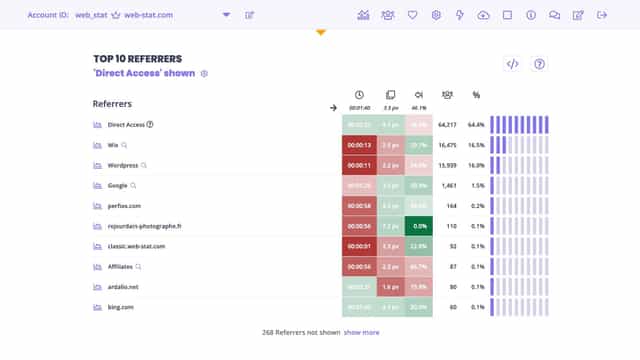
- Observe visitors interacting with your website, live.
- Full visitor details, including path through your site, and time on each page.
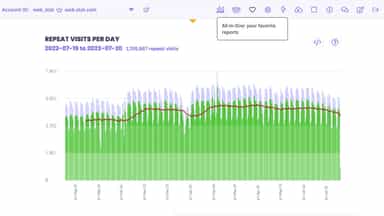
- Beautiful, user-friendly reports. View, print, email, share or export.




All the numbers
Every figure, side by side
A green dot marks the app ahead on a measured figure. Estimates, gaps and apps that leave no storefront trace never take the lead.
Adoption
| Measure |  Heatmap and User Journey |  WEB‑STAT |
|---|---|---|
| Detected stores | Not published | 107 |
| Net store change, 28 days | 0 | +12 |
| Stores added, 28 days | Not enough data | 12 |
| Big-brand share | Not enough data | Not enough data |
| Top store categories | Not published | Apparel & Accessories, Home & Garden, Health & Beauty |
| Top store countries | Not published | United States, United Kingdom, Australia |
Reviews
| Measure | Heatmap and User Journey | WEB‑STAT |
|---|---|---|
| App Store rating | 5.0 ★ | 5.0 ★ |
| App Store reviews | 1 | 12(ahead) |
| New reviews, 28 days | Not enough data | 1 |
| Reviewers a year or more in | Not enough data | Not enough data |
Pricing
| Measure | Heatmap and User Journey | WEB‑STAT |
|---|---|---|
| Free plan | Not listed | Yes |
| Lowest paid monthly plan | $1/month(ahead) | $4.95/month |
| Longest free trial | 30 days | Not listed |
| Plans listed | 1 | 5 |
Listing
| Measure | Heatmap and User Journey | WEB‑STAT |
|---|---|---|
| Shopify category rank | #330 | #255(ahead) |
| Shopify App Charts | Not on this week’s charts | #8 on Pricing moves in Analytics |
| Built for Shopify | No | No |
| Launched | May 14, 2025 | Oct 2, 2018 |
| Languages | 1 | 2 |
| Developer | DataScience@CausalFunnel | WEB-STAT |
FAQ
Heatmap and User Journey and WEB‑STAT: common questions
- Is Heatmap and User Journey or WEB‑STAT cheaper?
- Only WEB‑STAT lists a free plan. Paid plans start at $1/month for Heatmap and User Journey and $4.95/month for WEB‑STAT. Shoplist compares base prices only between monthly plans in the same currency; usage charges and annual plans vary, so check each plan’s limits.
- Which has better reviews, Heatmap and User Journey or WEB‑STAT?
- On the Shopify App Store: Heatmap and User Journey 5.0 from 1 reviews and WEB‑STAT 5.0 from 12 reviews.
- What features does each app list that the other doesn’t?
- Heatmap and User Journey lists 4 the others don’t mention, such as Abandoned cart, Checkout analytics, Heatmaps, UTM tracking. WEB‑STAT lists 11 the others don’t mention, such as Cohort analysis, Custom dashboards, Custom reports, Data export. A feature missing from a listing may still be supported; this compares what each App Store listing says.
- Where does this comparison’s data come from?
- Shoplist crawls Shopify storefronts to detect which apps each store runs, and reads each app’s Shopify App Store listing for reviews, pricing, features and integrations. Store counts are as of Oct 14, 2026 for Heatmap and User Journey, Nov 3, 2026 for WEB‑STAT; estimated figures are labeled.
How Shoplist compares apps
Store counts come from Shoplist’s crawl of Shopify storefronts, which detects the apps each store runs; they are as of Oct 14, 2026 for Heatmap and User Journey, Nov 3, 2026 for WEB‑STAT. Reviews, ratings, plans, features and integrations come from each app’s Shopify App Store listing. 28-day figures are labeled when estimated, and a figure that is missing or estimated never decides who leads. Read the methodology.