

GoGotama vs Kleio Analytics
Two Shopify apps, side by side: detected stores, momentum, reviews, plans, listed features and who runs each. Store counts as of Oct 13, 2026 for GoGotama, Oct 14, 2026 for Kleio Analytics.
The short answer
- Paid plans start at $299/month for GoGotama and $29/month for Kleio Analytics.
- Kleio Analytics lists 7 features GoGotama’s listing doesn’t mention, including Cohort analysis, Lifetime value (LTV), Multi-store reports.
Head to head


Momentum
New reviews each month
Review pace is the clearest public read on how fast an app is winning new merchants.
Clarity
Everything
- · 14-day free trial
- · All features
- · Unlimited orders
- · Unlimited revenue
- · Unlimited users
Coverage counts what each App Store listing names. Every feature, checked off app by app, is in Shoplist.
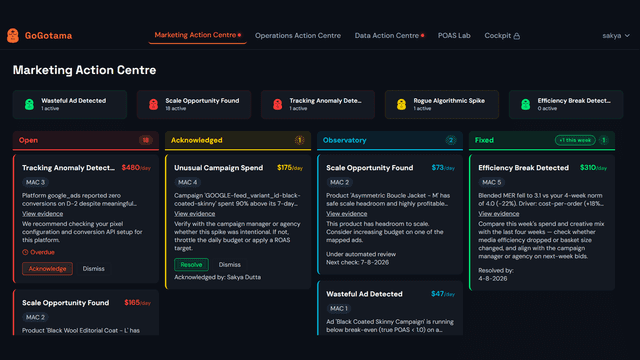
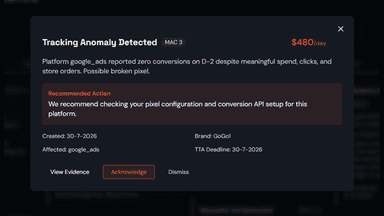
See every featureROAS says you're winning while rogue ads, leaked discounts, and dead stock quietly eat your profit. Gotama works like a hire, not a dashboard: he untangles your messy catalog & ad data with AI, and then with deterministic math builds your unit economics — CM3 and POAS daily. When he sees margin leaking, he fires a signal: its cost per day, the fix, and evidence to cross-check him.
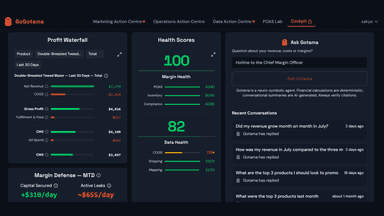
Hey, Mathias here (the founder). I was frustrated by other analytics tools and found them too expensive, so I built the analytics toolbox I've always dreamed of. Track your favorite metrics in the dashboard; connect ad channels and track your acquisition; break down your P&L to find what’s eating your margin; rank products by the profit and LTV they create; monitor inventory and get help merchandising; and much more.
- Actionable intelligence within hours of setup: curated, high value margin leaks
- Hunts the nine usual suspects daily — zombie ads, code leaks, below-cost SKUs
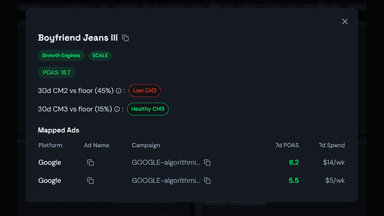
- POAS Lab: scale Growth Engines, cut Margin Vampires — decisions, not reports
- Every signal carries its cost per day, the fix, and evidence you can check
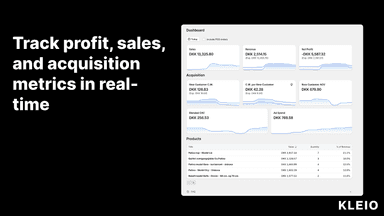
- Dashboard: Monitor your sales, profits, and customer acquisition in real time.
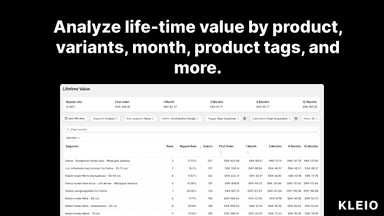
- Lifetime value analysis: Which products drive the most profits over time?
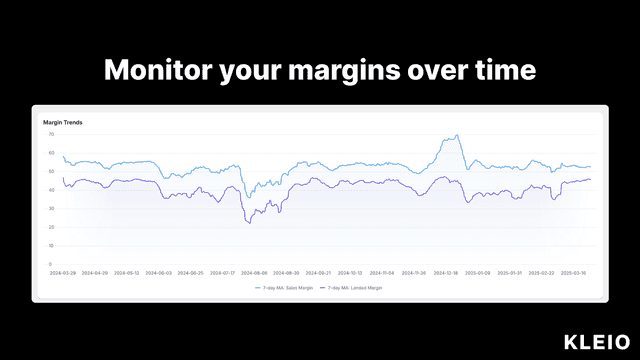
- Margin Analysis: What's your true margins after shipping, refunds and discounts?
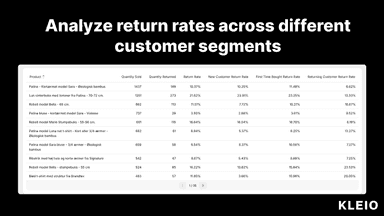
- Returns Analysis: Do you have any problematic products that are often returned?
All the numbers
Every figure, side by side
A green dot marks the app ahead on a measured figure. Estimates, gaps and apps that leave no storefront trace never take the lead.
Adoption
| Measure |  GoGotama |  Kleio Analytics |
|---|---|---|
| Detected stores | Not published | Not published |
| Net store change, 28 days | 0 | 0 |
| Stores added, 28 days | Not enough data | Not enough data |
| Big-brand share | Not enough data | Not enough data |
| Top store categories | Not published | Not published |
| Top store countries | Not published | Not published |
Reviews
| Measure | GoGotama | Kleio Analytics |
|---|---|---|
| App Store rating | Not published | 5.0 ★ |
| App Store reviews | Not published | 20 |
| New reviews, 28 days | Not enough data | Not enough data |
| Reviewers a year or more in | Not enough data | Not enough data |
Pricing
| Measure | GoGotama | Kleio Analytics |
|---|---|---|
| Free plan | Not listed | Not listed |
| Lowest paid monthly plan | $299/month | $29/month(ahead) |
| Longest free trial | 28 days | 14 days |
| Plans listed | 1 | 1 |
Listing
| Measure | GoGotama | Kleio Analytics |
|---|---|---|
| Shopify category rank | #1246 | #52(ahead) |
| Shopify App Charts | Not on this week’s charts | Not on this week’s charts |
| Built for Shopify | No | No |
| Launched | Jun 18, 2026 | Feb 19, 2025 |
| Languages | 1 | 1 |
| Developer | GoGotama | Kleio |
FAQ
GoGotama and Kleio Analytics: common questions
- Is GoGotama or Kleio Analytics cheaper?
- Paid plans start at $299/month for GoGotama and $29/month for Kleio Analytics. Shoplist compares base prices only between monthly plans in the same currency; usage charges and annual plans vary, so check each plan’s limits.
- What features does each app list that the other doesn’t?
- GoGotama lists 1 the others don’t mention, such as Data export. Kleio Analytics lists 7 the others don’t mention, such as Cohort analysis, Lifetime value (LTV), Multi-store reports, Purchase tracking. A feature missing from a listing may still be supported; this compares what each App Store listing says.
- Where does this comparison’s data come from?
- Shoplist crawls Shopify storefronts to detect which apps each store runs, and reads each app’s Shopify App Store listing for reviews, pricing, features and integrations. Store counts are as of Oct 13, 2026 for GoGotama, Oct 14, 2026 for Kleio Analytics; estimated figures are labeled.
How Shoplist compares apps
Store counts come from Shoplist’s crawl of Shopify storefronts, which detects the apps each store runs; they are as of Oct 13, 2026 for GoGotama, Oct 14, 2026 for Kleio Analytics. Reviews, ratings, plans, features and integrations come from each app’s Shopify App Store listing. 28-day figures are labeled when estimated, and a figure that is missing or estimated never decides who leads. Read the methodology.