

Forecaster vs Sizecurve
Two Shopify apps, side by side: detected stores, momentum, reviews, plans, listed features and who runs each. Store counts as of Nov 6, 2026 for Forecaster, Nov 12, 2026 for Sizecurve.
The short answer
- Only Sizecurve lists a free plan. Paid plans start at $14.99/month for Forecaster and $29/month for Sizecurve.
- Forecaster lists 11 features Sizecurve’s listing doesn’t mention, including Back-in-stock alerts, Email notifications, Insights.
Head to head


Pro
- · Unlimited Email Reorder Notifications
- · Unlimited Forecasts
Free
- · Broken size run alerts
- · Returns by style
- · Weekly email
Sizecurve Standard
- · Broken size run alerts
- · Purchase orders as CSV
- · Reorder quantities by size
- · Size curves net of returns
Coverage counts what each App Store listing names. Every feature, checked off app by app, is in Shoplist.
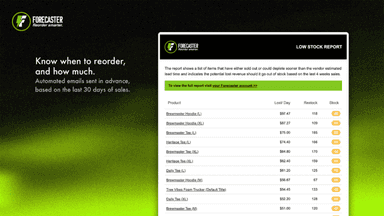
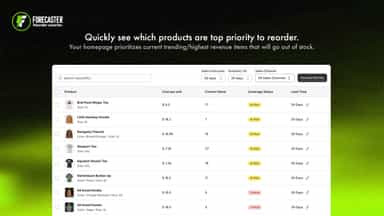
See every featureForecaster helps you know exactly when and how much to reorder. Using historical and seasonal sales data, it recommends reorder quantities by SKU, so you can restock the correct products, sizes, and colors without guessing. It also sends daily email alerts when products are trending toward out-of-stock and shows you the estimated revenue lost per day if they sell out.
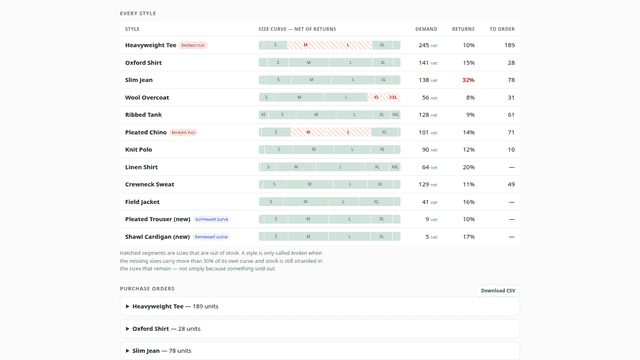
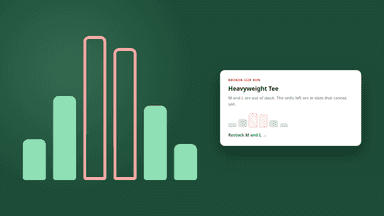
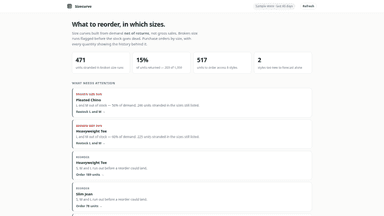
Most inventory tools forecast on gross sales. For apparel that is wrong in a costly way: the sizes that sell most are often the sizes that come back most. Sizecurve builds each style's size curve from demand net of returns, then says what to reorder in each size, after your own lead time and stock already incoming. A sold-out size counts at the rate it sold while in stock.
- We show you exactly how much to reorder.
- We tell you when an item is trending to go out of stock.
- We inform you how much revenue a day is lost if products do go out of stock.
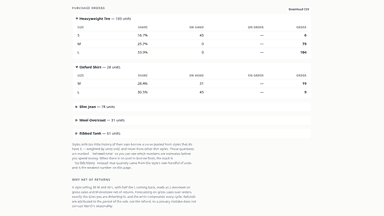
- Size curves built per style from demand net of returns, not gross sales
- Broken size runs flagged while the leftover stock can still be rescued
- Reorder quantities by size, covering lead time and net of stock on hand
- Styles too new to forecast borrow a curve and say so on every line


All the numbers
Every figure, side by side
A green dot marks the app ahead on a measured figure. Estimates, gaps and apps that leave no storefront trace never take the lead.
Adoption
| Measure |  Forecaster |  Sizecurve |
|---|---|---|
| Detected stores | Not published | Not published |
| Net store change, 28 days | 0 | 0 |
| Stores added, 28 days | Not enough data | Not enough data |
| Big-brand share | Not enough data | Not enough data |
| Top store categories | Not published | Not published |
| Top store countries | Not published | Not published |
Reviews
| Measure | Forecaster | Sizecurve |
|---|---|---|
| App Store rating | Not published | Not published |
| App Store reviews | Not published | Not published |
| New reviews, 28 days | Not enough data | Not enough data |
| Reviewers a year or more in | Not enough data | Not enough data |
Pricing
| Measure | Forecaster | Sizecurve |
|---|---|---|
| Free plan | Not listed | Yes |
| Lowest paid monthly plan | $14.99/month(ahead) | $29/month |
| Longest free trial | 30 days | 14 days |
| Plans listed | 1 | 2 |
Listing
| Measure | Forecaster | Sizecurve |
|---|---|---|
| Shopify category rank | #449(ahead) | #660 |
| Shopify App Charts | Not on this week’s charts | Not on this week’s charts |
| Built for Shopify | No | No |
| Launched | Jun 2, 2026 | Sep 29, 2026 |
| Languages | 1 | 1 |
| Developer | Forecaster | Bananafest Destiny |
FAQ
Forecaster and Sizecurve: common questions
- Is Forecaster or Sizecurve cheaper?
- Only Sizecurve lists a free plan. Paid plans start at $14.99/month for Forecaster and $29/month for Sizecurve. Shoplist compares base prices only between monthly plans in the same currency; usage charges and annual plans vary, so check each plan’s limits.
- What features does each app list that the other doesn’t?
- Forecaster lists 11 the others don’t mention, such as Back-in-stock alerts, Email notifications, Insights, Inventory sync. Sizecurve lists 3 the others don’t mention, such as Auto-restock, Inventory tracking, Stock replenishment. A feature missing from a listing may still be supported; this compares what each App Store listing says.
- Where does this comparison’s data come from?
- Shoplist crawls Shopify storefronts to detect which apps each store runs, and reads each app’s Shopify App Store listing for reviews, pricing, features and integrations. Store counts are as of Nov 6, 2026 for Forecaster, Nov 12, 2026 for Sizecurve; estimated figures are labeled.
How Shoplist compares apps
Store counts come from Shoplist’s crawl of Shopify storefronts, which detects the apps each store runs; they are as of Nov 6, 2026 for Forecaster, Nov 12, 2026 for Sizecurve. Reviews, ratings, plans, features and integrations come from each app’s Shopify App Store listing. 28-day figures are labeled when estimated, and a figure that is missing or estimated never decides who leads. Read the methodology.