
FastOG: Dynamic Social Cards vs Standout
Two Shopify apps, side by side: detected stores, momentum, reviews, plans, listed features and who runs each. Store counts as of Nov 16, 2026 for FastOG, Oct 13, 2026 for Standout.
The short answer
Head to head

Starter
- · 1 brand in Brand Studio
- · 700 creative tokens every month
- · Tokens cover images, video and copy
- · Tokens reset on your billing date
- · Up to 3 brand videos a month
- · Videos also draw from your tokens
Pro
- · 1800 creative tokens every month
- · For stores publishing content frequently
- · Tokens cover images, video and copy
- · Tokens reset on your billing date
- · Up to 3 brands in Brand Studio
- · Up to 8 brand videos a month
Coverage counts what each App Store listing names. Every feature, checked off app by app, is in Shoplist.
See every featureWhen someone shares a link to your store, the preview image is whichever photo Shopify picks. FastOG replaces it with a cover you design. You choose a template, colors and wording once for each page type: product, collection, home page and blog. Every page of that type then uses that cover, so there is nothing to set up per product as your catalogue grows.
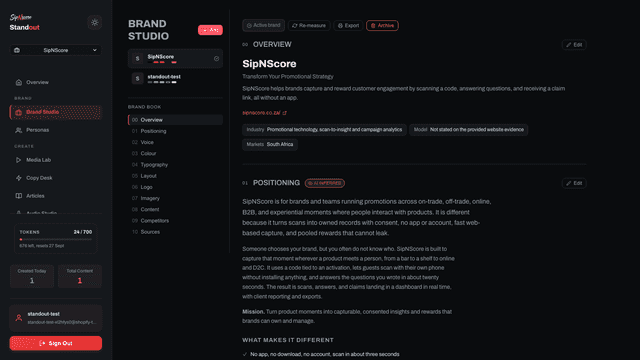
Standout measures your storefront and builds a brand book from it: colours, voice, audience and competitors. Everything you generate starts from that brand book, so posts, product images, videos and podcasts match how your store already looks and sounds. Create social content in one sitting, design product visuals in the studio, and publish captions written in your voice.
- Designed social covers for your product, collection, home and blog pages
- Set a cover once per page type, and new products are covered automatically
- Cover sets suggested from your store's own products and colours
- See every cover exactly as it will look before you save it
- Brand book measured from your storefront: colours, voice, audience, competitors
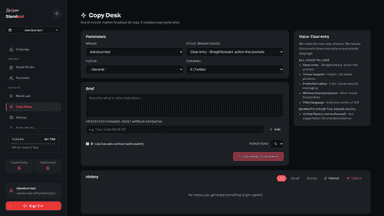
- On brand social posts, captions and articles written in your store's voice
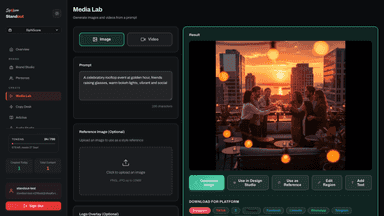
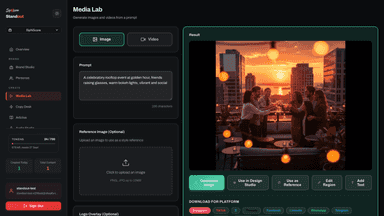
- Product images and short videos generated in your brand style
- Podcasts and audio spots from a script or a prompt
All the numbers
Every figure, side by side
A green dot marks the app ahead on a measured figure. Estimates, gaps and apps that leave no storefront trace never take the lead.
Adoption
| Measure |  Standout | |
|---|---|---|
| Detected stores | Not published | Not published |
| Net store change, 28 days | 0 | 0 |
| Stores added, 28 days | Not enough data | Not enough data |
| Big-brand share | Not enough data | Not enough data |
| Top store categories | Not published | Not published |
| Top store countries | Not published | Not published |
Reviews
| Measure | Standout | |
|---|---|---|
| App Store rating | Not published | 5.0 ★ |
| App Store reviews | Not published | 1 |
| New reviews, 28 days | Not enough data | Not enough data |
| Reviewers a year or more in | Not enough data | Not enough data |
FAQ
FastOG and Standout: common questions
- Where does this comparison’s data come from?
- Shoplist crawls Shopify storefronts to detect which apps each store runs, and reads each app’s Shopify App Store listing for reviews, pricing, features and integrations. Store counts are as of Nov 16, 2026 for FastOG, Oct 13, 2026 for Standout; estimated figures are labeled.
How Shoplist compares apps
Store counts come from Shoplist’s crawl of Shopify storefronts, which detects the apps each store runs; they are as of Nov 16, 2026 for FastOG, Oct 13, 2026 for Standout. Reviews, ratings, plans, features and integrations come from each app’s Shopify App Store listing. 28-day figures are labeled when estimated, and a figure that is missing or estimated never decides who leads. Read the methodology.