
Customer Map & Order Trends vs Interactive Sales Heat Map
Two Shopify apps, side by side: detected stores, momentum, reviews, plans, listed features and who runs each. Store counts as of Oct 14, 2026.
The short answer
- Paid plans start at $4.99/month for Customer Map & Order Trends and $5/month for Interactive Sales Heat Map.
- Customer Map & Order Trends lists 3 features Interactive Sales Heat Map’s listing doesn’t mention, including Event tracking, Lifetime value (LTV), Segmentation.
Head to head


Low Volume
- · Stores with less than 100 Monthly Orders
- · Switch Between Billing/Shipping Address
- · View Order Cluster
- · View Order Details
- · View Order Locations on Map
Medium Volume
- · Stores with 100-499 Monthly Orders
- · Switch Between Billing/Shipping Address
- · View Order Cluster
- · View Order Details
- · View Order Locations on Map
High Volume
- · Stores with monthly orders over 499
- · Switch Between Billing/Shipping Address
- · View Order Cluster
- · View Order Details
- · View Order Locations on Map
Monthly Plan
Coverage counts what each App Store listing names. Every feature, checked off app by app, is in Shoplist.
See every featureInstantly map your Shopify orders by location. Filter by date, product, order value, payment status, and fulfillment status. Export filtered views as CSV. Know your best markets in seconds.
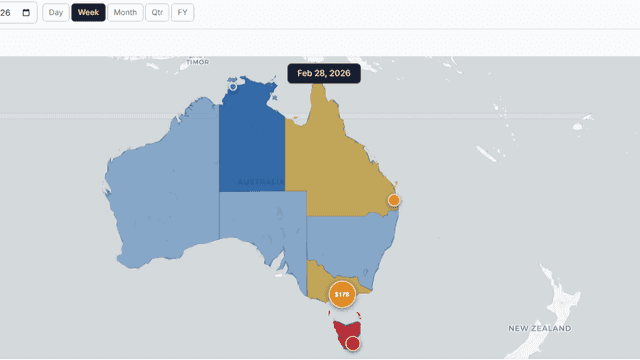
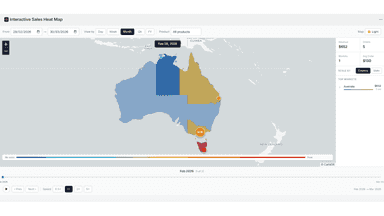
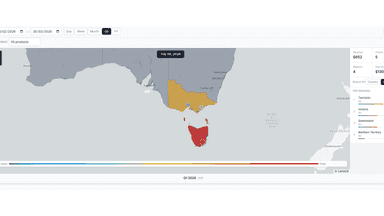
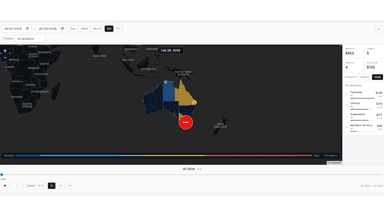
Sales Heatmap transforms your Shopify order data into a beautiful interactive world map. See exactly which countries, states and cities are driving your revenue using a heat colour scale from cool blue to burning red. Step through your sales history by day, week, month, quarter or financial year. Filter by product, drill down to state level, and watch your top markets update in real time as new orders come in.
- Interactive order map to track sales and customer locations in real time
- Filter orders by product, location, and timeframe for better insights
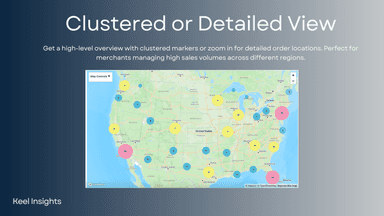
- Switch between clustered and detailed order views for clear analytics
- Interactive world map with zoom, pan and dark or light mode
- Animated timeline — step through sales by day, week, month or quarter
- Country and state level heatmap colouring
- City and region order clustering with revenue tooltips


All the numbers
Every figure, side by side
A green dot marks the app ahead on a measured figure. Estimates, gaps and apps that leave no storefront trace never take the lead.
Adoption
| Measure |  Customer Map & Order Trends |  Interactive Sales Heat Map |
|---|---|---|
| Detected stores | Not published | Not published |
| Net store change, 28 days | 0 | 0 |
| Stores added, 28 days | Not enough data | Not enough data |
| Big-brand share | Not enough data | Not enough data |
| Top store categories | Not published | Not published |
| Top store countries | Not published | Not published |
Reviews
| Measure | Customer Map & Order Trends | Interactive Sales Heat Map |
|---|---|---|
| App Store rating | Not published | Not published |
| App Store reviews | Not published | Not published |
| New reviews, 28 days | Not enough data | Not enough data |
| Reviewers a year or more in | Not enough data | Not enough data |
Pricing
| Measure | Customer Map & Order Trends | Interactive Sales Heat Map |
|---|---|---|
| Free plan | Not listed | Not listed |
| Lowest paid monthly plan | $4.99/month(ahead) | $5/month |
| Longest free trial | 2 days | 3 days |
| Plans listed | 3 | 1 |
Listing
| Measure | Customer Map & Order Trends | Interactive Sales Heat Map |
|---|---|---|
| Shopify category rank | #666(ahead) | #788 |
| Shopify App Charts | Not on this week’s charts | Not on this week’s charts |
| Built for Shopify | No | No |
| Launched | Feb 11, 2025 | Apr 29, 2026 |
| Languages | 1 | 1 |
| Developer | J2 Analytics | Meadrisker Software |
FAQ
Customer Map & Order Trends and Interactive Sales Heat Map: common questions
- Is Customer Map & Order Trends or Interactive Sales Heat Map cheaper?
- Paid plans start at $4.99/month for Customer Map & Order Trends and $5/month for Interactive Sales Heat Map. Shoplist compares base prices only between monthly plans in the same currency; usage charges and annual plans vary, so check each plan’s limits.
- What features does each app list that the other doesn’t?
- Customer Map & Order Trends lists 3 the others don’t mention, such as Event tracking, Lifetime value (LTV), Segmentation. A feature missing from a listing may still be supported; this compares what each App Store listing says.
- Where does this comparison’s data come from?
- Shoplist crawls Shopify storefronts to detect which apps each store runs, and reads each app’s Shopify App Store listing for reviews, pricing, features and integrations. Store counts are as of Oct 14, 2026; estimated figures are labeled.
How Shoplist compares apps
Store counts come from Shoplist’s crawl of Shopify storefronts, which detects the apps each store runs; they are as of Oct 14, 2026. Reviews, ratings, plans, features and integrations come from each app’s Shopify App Store listing. 28-day figures are labeled when estimated, and a figure that is missing or estimated never decides who leads. Read the methodology.