

Core — Your Store Fix Engine vs ReasonWhy
Two Shopify apps, side by side: detected stores, momentum, reviews, plans, listed features and who runs each. Store counts as of Oct 14, 2026.
The short answer
- Core lists 8 features ReasonWhy’s listing doesn’t mention, including Benchmarking, Checkout analytics, Data export.
Head to head


Core Full Access
Starter
- · AI return-reason clustering
- · Ranked “fix these first” opportunities
- · Up to 100 returns analysed / month
Growth
- · Before / after impact tracking
- · Everything in Starter
- · Up to 500 returns analysed / month
Pro
- · Everything in Growth
- · Priority support
- · Product review integrations
- · Unlimited returns analysed
Coverage counts what each App Store listing names. Every feature, checked off app by app, is in Shoplist.
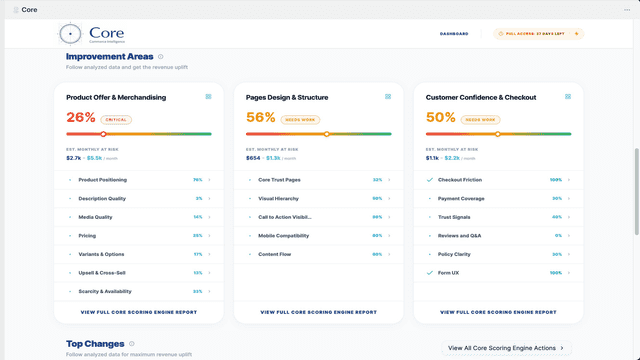
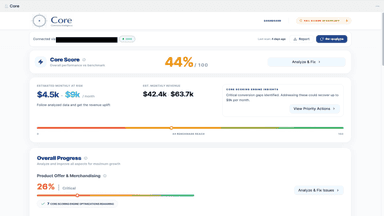
See every featureCore connects to your store, scores every product and page across three pillars — Products, Page Design, and Customer Confidence — and quantifies exactly how much revenue each issue is costing you. Then it tells you precisely what to fix and how, in plain English. No consultants. No guesswork. Weekly automatic rescans track your progress over time, so your store keeps improving.
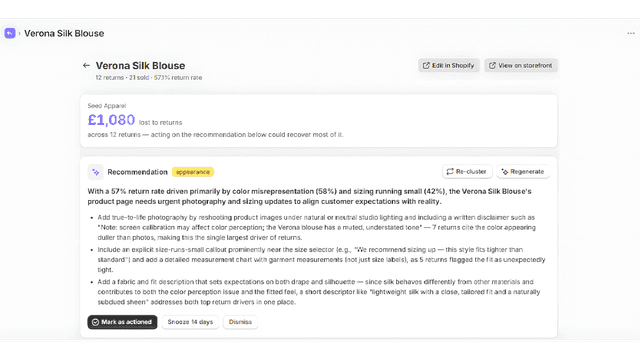
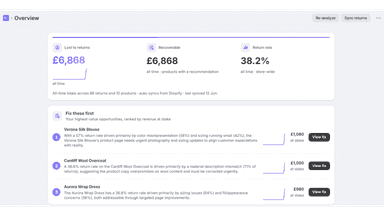
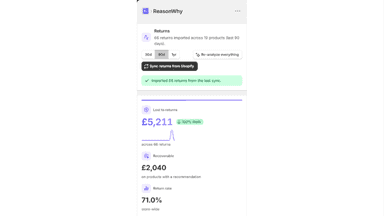
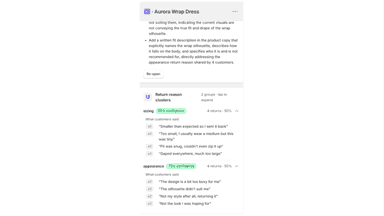
ReasonWhy reads your existing returns data and uses AI to group return reasons into clear categories, so you can stop guessing why customers send items back. It ranks your products by return impact and explains the real reason behind each one, whether sizing, fit, quality, or misleading product pages, then gives you evidence-backed fixes.
- Per-product scores across Offers, Page Design, and Customer Confidence pillars.
- Quantifies revenue at risk per product so you know exactly where to focus first.
- Plain-English instructions — tell you exactly what to change and how to do it.
- Weekly automatic rescans track score improvements over time.
- AI-grouped return reasons that turn raw returns data into clear, fixable themes
- Products ranked by return impact so you fix the costliest issues first
- Evidence-backed page fixes for sizing, fit, imagery, and copy
- Reads from your existing returns and review tools, no workflow changes
All the numbers
Every figure, side by side
A green dot marks the app ahead on a measured figure. Estimates, gaps and apps that leave no storefront trace never take the lead.
Adoption
| Measure |  Core |  ReasonWhy |
|---|---|---|
| Detected stores | Not published | Not published |
| Net store change, 28 days | 0 | 0 |
| Stores added, 28 days | Not enough data | Not enough data |
| Big-brand share | Not enough data | Not enough data |
| Top store categories | Not published | Not published |
| Top store countries | Not published | Not published |
Reviews
| Measure | Core | ReasonWhy |
|---|---|---|
| App Store rating | Not published | Not published |
| App Store reviews | Not published | Not published |
| New reviews, 28 days | Not enough data | Not enough data |
| Reviewers a year or more in | Not enough data | Not enough data |
FAQ
Core and ReasonWhy: common questions
- What features does each app list that the other doesn’t?
- Core lists 8 the others don’t mention, such as Benchmarking, Checkout analytics, Data export, Funnel analysis. ReasonWhy lists 2 the others don’t mention, such as Activity tracking, GDPR compliance. A feature missing from a listing may still be supported; this compares what each App Store listing says.
- Where does this comparison’s data come from?
- Shoplist crawls Shopify storefronts to detect which apps each store runs, and reads each app’s Shopify App Store listing for reviews, pricing, features and integrations. Store counts are as of Oct 14, 2026; estimated figures are labeled.
How Shoplist compares apps
Store counts come from Shoplist’s crawl of Shopify storefronts, which detects the apps each store runs; they are as of Oct 14, 2026. Reviews, ratings, plans, features and integrations come from each app’s Shopify App Store listing. 28-day figures are labeled when estimated, and a figure that is missing or estimated never decides who leads. Read the methodology.