

CMO Analytics | Profit Tracker vs Marge: Real Profit Tracker
Two Shopify apps, side by side: detected stores, momentum, reviews, plans, listed features and who runs each. Store counts as of Oct 13, 2026.
The short answer
- Paid plans start at $29.99/month for CMO Analytics and $19/month for Marge.
- CMO Analytics lists 7 features Marge’s listing doesn’t mention, including COGS tracking, Daily sales summary, Expense tracking.
Head to head


Starter
- · Custom COGS & Logistic Fees
- · Historical Data (up to 2 years)
- · Influencer Cost Tracking
- · Live P&L Dashboard
- · Meta & Google Ads Integration
- · Up to 500 orders/month
Growth
- · Custom COGS & Logistic Fees
- · Historical Data (up to 2 years)
- · Influencer Cost Tracking
- · Live P&L Dashboard
- · Meta & Google Ads Integration
- · Up to 5,000 orders/month
Scale
- · Custom COGS & Logistic Fees
- · Historical Data (up to 2 years)
- · Influencer Cost Tracking
- · Live P&L Dashboard
- · Meta & Google Ads Integration
- · Unlimited orders
Monthly Plan
- · Automatic order sync
- · CSV export
- · Real profit reports
Coverage counts what each App Store listing names. Every feature, checked off app by app, is in Shoplist.
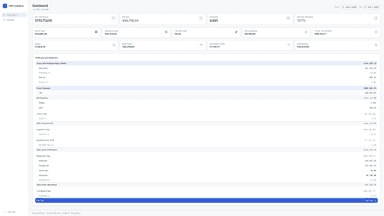
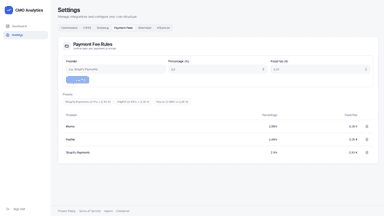
See every featureCMO Analytics is a P&L dashboard and profit analytics platform built for merchants who want to know their true profitability. Connect your advertising channels, input COGS and logistics costs, and get a complete profit and loss overview in one place.
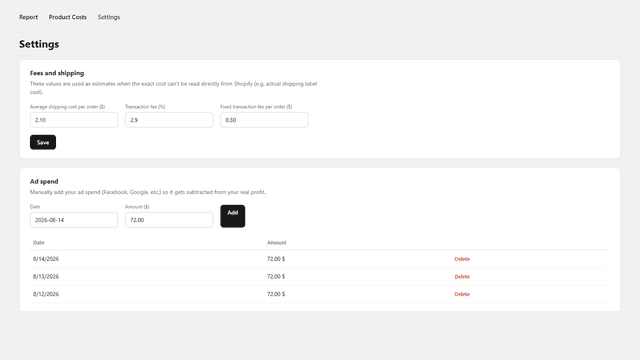
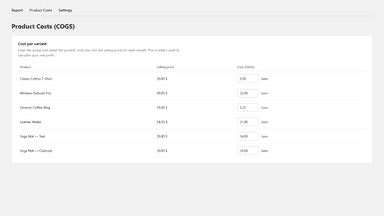
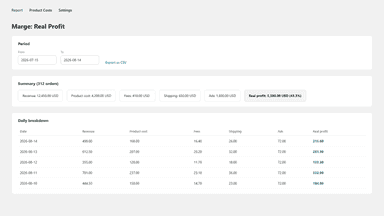
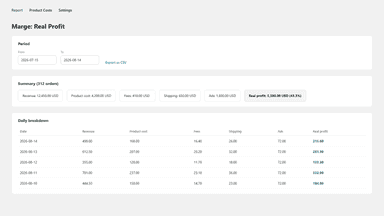
Marge shows your real profit per day, not just revenue. It automatically pulls your orders and payment fees from Shopify, then combines them with your product costs, shipping, and ad spend to show exactly what you're making. Set your product costs once and get accurate margins going forward. No bloated dashboard, just accurate numbers. Built for merchants who want clarity, not another chart to interpret.
- Real-time P&L dashboard with true profit and profitability tracking
- Connect ad channels for unified profit analytics and insights
- Input COGS & logistics costs for accurate profit calculation
- Profit insights platform — no spreadsheets, no manual reporting
- Real profit per day: revenue minus COGS, fees, shipping, and ad spend
- Set product costs once, get accurate margins automatically going forward
- Manual ad spend entry, no complicated ad account connections needed


All the numbers
Every figure, side by side
A green dot marks the app ahead on a measured figure. Estimates, gaps and apps that leave no storefront trace never take the lead.
Adoption
| Measure |  CMO Analytics |  Marge |
|---|---|---|
| Detected stores | Not published | Not published |
| Net store change, 28 days | 0 | 0 |
| Stores added, 28 days | Not enough data | Not enough data |
| Big-brand share | Not enough data | Not enough data |
| Top store categories | Not published | Not published |
| Top store countries | Not published | Not published |
Reviews
| Measure | CMO Analytics | Marge |
|---|---|---|
| App Store rating | Not published | Not published |
| App Store reviews | Not published | Not published |
| New reviews, 28 days | Not enough data | Not enough data |
| Reviewers a year or more in | Not enough data | Not enough data |
Pricing
| Measure | CMO Analytics | Marge |
|---|---|---|
| Free plan | Not listed | Not listed |
| Lowest paid monthly plan | $29.99/month | $19/month(ahead) |
| Longest free trial | 14 days | 7 days |
| Plans listed | 3 | 1 |
Listing
| Measure | CMO Analytics | Marge |
|---|---|---|
| Shopify category rank | #308(ahead) | #341 |
| Shopify App Charts | Not on this week’s charts | Not on this week’s charts |
| Built for Shopify | No | No |
| Launched | May 20, 2026 | Aug 25, 2026 |
| Languages | 1 | 2 |
| Developer | CMO Analytics | François Larouche |
FAQ
CMO Analytics and Marge: common questions
- Is CMO Analytics or Marge cheaper?
- Paid plans start at $29.99/month for CMO Analytics and $19/month for Marge. Shoplist compares base prices only between monthly plans in the same currency; usage charges and annual plans vary, so check each plan’s limits.
- What features does each app list that the other doesn’t?
- CMO Analytics lists 7 the others don’t mention, such as COGS tracking, Daily sales summary, Expense tracking, Historical data import. Marge lists 2 the others don’t mention, such as Cash flow, Order details. A feature missing from a listing may still be supported; this compares what each App Store listing says.
- Where does this comparison’s data come from?
- Shoplist crawls Shopify storefronts to detect which apps each store runs, and reads each app’s Shopify App Store listing for reviews, pricing, features and integrations. Store counts are as of Oct 13, 2026; estimated figures are labeled.
How Shoplist compares apps
Store counts come from Shoplist’s crawl of Shopify storefronts, which detects the apps each store runs; they are as of Oct 13, 2026. Reviews, ratings, plans, features and integrations come from each app’s Shopify App Store listing. 28-day figures are labeled when estimated, and a figure that is missing or estimated never decides who leads. Read the methodology.