

Clean Info Tables & Charts vs Double Holo
Two Shopify apps, side by side: detected stores, momentum, reviews, plans, listed features and who runs each. Store counts as of Oct 13, 2026.
The short answer
Head to head


Free Plan
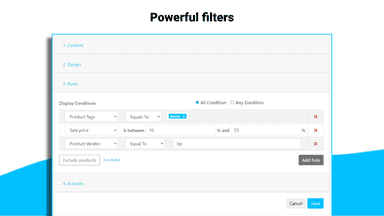
- · 20+ Display Rules
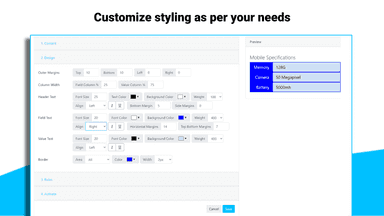
- · Custom Styling
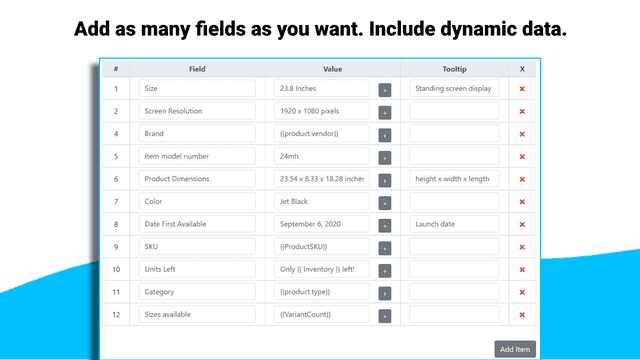
- · Dynamic Data Fields
- · Up to 500 tables on unlimited products
Starter
- · Basic Market Data
Pro
- · Detailed Market Data
- · Sentiment
Coverage counts what each App Store listing names. Every feature, checked off app by app, is in Shoplist.
See every featureAdd professional-looking specification tables and charts to your product pages to present details in a clear and structured way. Transform text-heavy descriptions into visually engaging layouts that match your brand’s style, making information easier to scan and more appealing to shoppers.
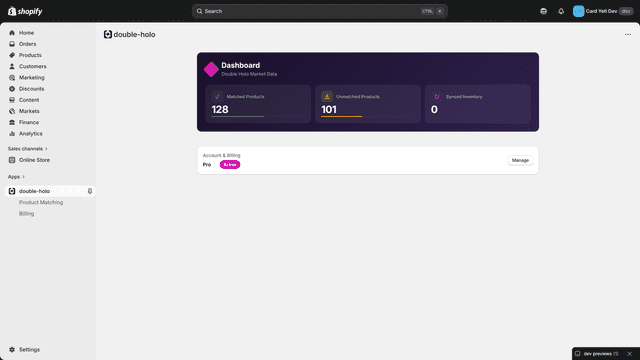
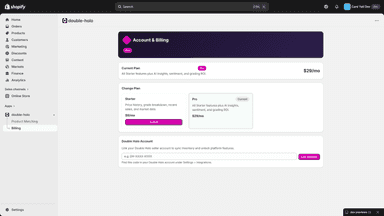
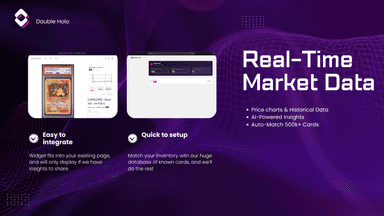
Double Holo automatically matches your trading card products to our market database and displays a customizable widget on your storefront. Shoppers see live charts, period highs and lows, and trends. Upgrade to Starter for recent data and grading population breakdowns, or Pro for AI-powered forecasts, market sentiment, and grading ROI analysis.
- Customizable design. Flexible position. Screen size responsive. Fast loading.
- Rule based automation. Powerful filters. Geotarget. Multi-lingual.
- Insert dynamic data: add product attributes, metafields, links etc
- Show more than one table, on products that fulfill the display rules.
- Real-time charts with historical data for trading cards
- Auto-match your products to our database of 500K+ cards
- Recent sales data and graded population breakdowns
- AI-powered forecasts and market sentiment analysis

All the numbers
Every figure, side by side
A green dot marks the app ahead on a measured figure. Estimates, gaps and apps that leave no storefront trace never take the lead.
Adoption
| Measure |  Clean Info Tables & Charts |  Double Holo |
|---|---|---|
| Detected stores | Not published | Not published |
| Net store change, 28 days | 0 | 0 |
| Stores added, 28 days | Not enough data | Not enough data |
| Big-brand share | Not enough data | Not enough data |
| Top store categories | Not published | Not published |
| Top store countries | Not published | Not published |
Reviews
| Measure | Clean Info Tables & Charts | Double Holo |
|---|---|---|
| App Store rating | Not published | Not published |
| App Store reviews | Not published | Not published |
| New reviews, 28 days | Not enough data | Not enough data |
| Reviewers a year or more in | Not enough data | Not enough data |
Pricing
| Measure | Clean Info Tables & Charts | Double Holo |
|---|---|---|
| Free plan | Not listed | Not listed |
| Lowest paid monthly plan | No monthly plan listed | $9/month |
| Longest free trial | Not listed | 7 days |
| Plans listed | 1 | 2 |
Listing
| Measure | Clean Info Tables & Charts | Double Holo |
|---|---|---|
| Shopify category rank | #121 | #170 |
| Shopify App Charts | Not on this week’s charts | Not on this week’s charts |
| Built for Shopify | No | No |
| Launched | Jun 10, 2022 | May 1, 2026 |
| Languages | 1 | 1 |
| Developer | Thalia | Double Holo |
FAQ
Clean Info Tables & Charts and Double Holo: common questions
- Where does this comparison’s data come from?
- Shoplist crawls Shopify storefronts to detect which apps each store runs, and reads each app’s Shopify App Store listing for reviews, pricing, features and integrations. Store counts are as of Oct 13, 2026; estimated figures are labeled.
How Shoplist compares apps
Store counts come from Shoplist’s crawl of Shopify storefronts, which detects the apps each store runs; they are as of Oct 13, 2026. Reviews, ratings, plans, features and integrations come from each app’s Shopify App Store listing. 28-day figures are labeled when estimated, and a figure that is missing or estimated never decides who leads. Read the methodology.