

Chart Candy vs Store Analytics by Audiosdroid
Two Shopify apps, side by side: detected stores, momentum, reviews, plans, listed features and who runs each. Store counts as of Oct 13, 2026.
The short answer
- Both list a free plan. Paid plans start at $9.99/month for Chart Candy and $2.99/month for Store Analytics by Audiosdroid.
- Store Analytics by Audiosdroid lists 8 features Chart Candy’s listing doesn’t mention, including Activity tracking, Checkout analytics, Historical analysis.
Head to head


Chart Candy Free
- · 14 Day Rolling Charts
Chart Candy Plus
- · 133 Day Rolling Charts
Chart Candy Pro
- · 365 Day Rolling Charts
Free
- · 90-day data history
- · Overview, Sales & Revenue, Products tabs
- · Simple dashboards for key metrics
Pro (Most Popular)
- · 3-year historical data
- · Actionable smart insights for growth
- · All 9 dashboard tabs + advanced insights
- · Early adopter launch pricing
- · Monthly email reports
- · Unlimited PDF exports, CSV (Products)
Enterprise
- · All 9 dashboard tabs + advanced insights
- · CSV exports (all dashboards)
- · Early adopter launch pricing
- · Unlimited data history
- · Weekly + monthly automated reports
Coverage counts what each App Store listing names. Every feature, checked off app by app, is in Shoplist.
See every featureMeet ChartCandy — the smarter way to visualize your data. From sales metrics to marketing performance, ChartCandy helps businesses turn spreadsheets and analytics into beautiful, real-time dashboards that make decision-making faster and easier.
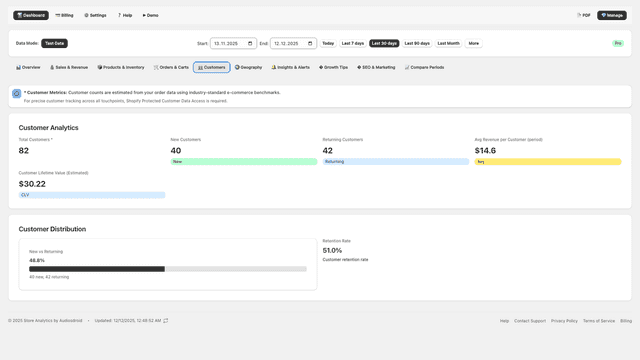
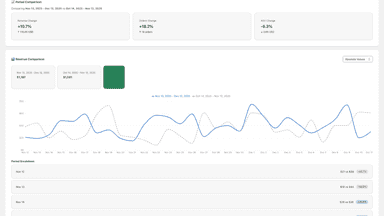
Store Analytics by Audiosdroid turns Shopify data into actionable insights. Go beyond basic reports to understand customer value, retention, and product performance. Track sales, compare periods, monitor trends, and see which products drive the most revenue for your store. Receive automated alerts for key changes and insights. Designed for merchants who want deep analytics without a data team.
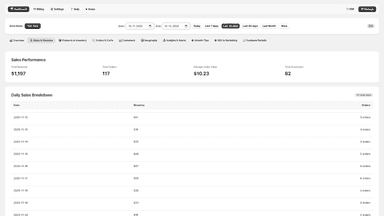
- Sales & revenue at a glance
- Top sellers, mix, and product insights
- A dashboard that fits how you read numbers
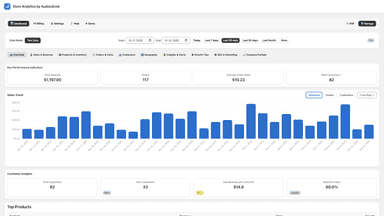
- Unified dashboard for sales, products, traffic, and customers
- Smart suggestions that highlight trends and improvement areas
- Customer segmentation with 11 RFM segments for targeted strategies
- Product performance: top performers and underperformers


All the numbers
Every figure, side by side
A green dot marks the app ahead on a measured figure. Estimates, gaps and apps that leave no storefront trace never take the lead.
Adoption
| Measure |  Chart Candy |  Store Analytics by Audiosdroid |
|---|---|---|
| Detected stores | Not published | Not published |
| Net store change, 28 days | 0 | 0 |
| Stores added, 28 days | Not enough data | Not enough data |
| Big-brand share | Not enough data | Not enough data |
| Top store categories | Not published | Not published |
| Top store countries | Not published | Not published |
Reviews
| Measure | Chart Candy | Store Analytics by Audiosdroid |
|---|---|---|
| App Store rating | Not published | Not published |
| App Store reviews | Not published | Not published |
| New reviews, 28 days | Not enough data | Not enough data |
| Reviewers a year or more in | Not enough data | Not enough data |
Pricing
| Measure | Chart Candy | Store Analytics by Audiosdroid |
|---|---|---|
| Free plan | Yes | Yes |
| Lowest paid monthly plan | $9.99/month | $2.99/month(ahead) |
| Longest free trial | Not listed | 30 days |
| Plans listed | 3 | 3 |
Listing
| Measure | Chart Candy | Store Analytics by Audiosdroid |
|---|---|---|
| Shopify category rank | #1287(ahead) | #1298 |
| Shopify App Charts | Not on this week’s charts | Not on this week’s charts |
| Built for Shopify | No | No |
| Launched | May 14, 2026 | Dec 23, 2025 |
| Languages | 1 | 1 |
| Developer | Vectorize | Audiosdroid OU |
FAQ
Chart Candy and Store Analytics by Audiosdroid: common questions
- Is Chart Candy or Store Analytics by Audiosdroid cheaper?
- Both list a free plan. Paid plans start at $9.99/month for Chart Candy and $2.99/month for Store Analytics by Audiosdroid. Shoplist compares base prices only between monthly plans in the same currency; usage charges and annual plans vary, so check each plan’s limits.
- What features does each app list that the other doesn’t?
- Chart Candy lists 3 the others don’t mention, such as Marketing attribution, Page views, UTM tracking. Store Analytics by Audiosdroid lists 8 the others don’t mention, such as Activity tracking, Checkout analytics, Historical analysis, Lifetime value (LTV). A feature missing from a listing may still be supported; this compares what each App Store listing says.
- Where does this comparison’s data come from?
- Shoplist crawls Shopify storefronts to detect which apps each store runs, and reads each app’s Shopify App Store listing for reviews, pricing, features and integrations. Store counts are as of Oct 13, 2026; estimated figures are labeled.
How Shoplist compares apps
Store counts come from Shoplist’s crawl of Shopify storefronts, which detects the apps each store runs; they are as of Oct 13, 2026. Reviews, ratings, plans, features and integrations come from each app’s Shopify App Store listing. 28-day figures are labeled when estimated, and a figure that is missing or estimated never decides who leads. Read the methodology.