

Chart Candy vs CN Graphs & Charts
Two Shopify apps, side by side: detected stores, momentum, reviews, plans, listed features and who runs each. Store counts as of Oct 13, 2026.
The short answer
- Both list a free plan. Paid plans start at $9.99/month for Chart Candy and $5/month for CN Graphs & Charts.
- Chart Candy lists 7 features CN Graphs & Charts’s listing doesn’t mention, including Analytics dashboard, Custom dashboards, Event tracking.
Head to head


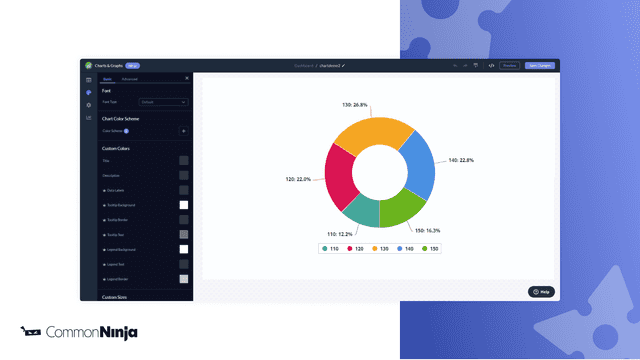
Powerful data visualization tool for creating graphs & charts
Momentum
New reviews each month
Review pace is the clearest public read on how fast an app is winning new merchants.
Chart Candy Free
- · 14 Day Rolling Charts
Chart Candy Plus
- · 133 Day Rolling Charts
Chart Candy Pro
- · 365 Day Rolling Charts
Free Plan
- · 1 Series
- · 10 Data rows
- · 2 Charts
- · 3 Charts types
- · Custom fonts
Basic Plan
- · 10 Charts
- · 3 Series
- · 30 Data rows
- · 6 Charts types
- · Ads Removal
- · Custom design
Pro Plan
- · 10 Series
- · 13 Charts types
- · 200 Charts
- · 500 Data rows
- · Ads Removal
- · Auto data refresh
Business Plan
- · 1,000 Charts
- · 20 Charts types
- · 5,000 Data rows
- · 50 Series
- · Ads Removal
- · CSV importer
Coverage counts what each App Store listing names. Every feature, checked off app by app, is in Shoplist.
See every featureMeet ChartCandy — the smarter way to visualize your data. From sales metrics to marketing performance, ChartCandy helps businesses turn spreadsheets and analytics into beautiful, real-time dashboards that make decision-making faster and easier.
Transform store data into visuals that sell. Create 20+ chart types, from bar to interactive pie, and place them anywhere in your store to grab attention and keep visitors engaged. Import from CSV or Google Sheets for instant updates, or connect live data sources for automatic refreshes. Customize colors, fonts, and layouts to perfectly match your brand.
- Sales & revenue at a glance
- Top sellers, mix, and product insights
- A dashboard that fits how you read numbers
- 20 different types of charts that will enable you to deliver information.
- Convert CSV file into an interactive chart or easily connect it to external URL.
- Multiple Skins & Layouts: Lots of beautifully designed templates to choose from.
- Rich styling options with fully customizable design features.


All the numbers
Every figure, side by side
A green dot marks the app ahead on a measured figure. Estimates, gaps and apps that leave no storefront trace never take the lead.
Adoption
| Measure |  Chart Candy |  CN Graphs & Charts |
|---|---|---|
| Detected stores | Not published | Not published |
| Net store change, 28 days | 0 | 0 |
| Stores added, 28 days | Not enough data | Not enough data |
| Big-brand share | Not enough data | Not enough data |
| Top store categories | Not published | Not published |
| Top store countries | Not published | Not published |
Reviews
| Measure | Chart Candy | CN Graphs & Charts |
|---|---|---|
| App Store rating | Not published | 5.0 ★ |
| App Store reviews | Not published | 2 |
| New reviews, 28 days | Not enough data | 0 |
| Reviewers a year or more in | Not enough data | Not enough data |
Pricing
| Measure | Chart Candy | CN Graphs & Charts |
|---|---|---|
| Free plan | Yes | Yes |
| Lowest paid monthly plan | $9.99/month | $5/month(ahead) |
| Longest free trial | Not listed | 3 days |
| Plans listed | 3 | 4 |
Listing
| Measure | Chart Candy | CN Graphs & Charts |
|---|---|---|
| Shopify category rank | #1290 | #175 |
| Shopify App Charts | Not on this week’s charts | Not on this week’s charts |
| Built for Shopify | No | No |
| Launched | May 14, 2026 | Aug 12, 2021 |
| Languages | 1 | 1 |
| Developer | Vectorize | Common Ninja |
FAQ
Chart Candy and CN Graphs & Charts: common questions
- Is Chart Candy or CN Graphs & Charts cheaper?
- Both list a free plan. Paid plans start at $9.99/month for Chart Candy and $5/month for CN Graphs & Charts. Shoplist compares base prices only between monthly plans in the same currency; usage charges and annual plans vary, so check each plan’s limits.
- What features does each app list that the other doesn’t?
- Chart Candy lists 7 the others don’t mention, such as Analytics dashboard, Custom dashboards, Event tracking, Marketing attribution. A feature missing from a listing may still be supported; this compares what each App Store listing says.
- Where does this comparison’s data come from?
- Shoplist crawls Shopify storefronts to detect which apps each store runs, and reads each app’s Shopify App Store listing for reviews, pricing, features and integrations. Store counts are as of Oct 13, 2026; estimated figures are labeled.
How Shoplist compares apps
Store counts come from Shoplist’s crawl of Shopify storefronts, which detects the apps each store runs; they are as of Oct 13, 2026. Reviews, ratings, plans, features and integrations come from each app’s Shopify App Store listing. 28-day figures are labeled when estimated, and a figure that is missing or estimated never decides who leads. Read the methodology.