
Causely vs ROAS Analytics & Alerts ‑ OTB
Two Shopify apps, side by side: detected stores, momentum, reviews, plans, listed features and who runs each. Store counts as of May 30, 2026 for Causely, Oct 29, 2026 for ROAS Analytics & Alerts.
The short answer
- Only ROAS Analytics & Alerts lists a free plan.
- ROAS Analytics & Alerts lists 13 features Causely’s listing doesn’t mention, including Activity tracking, Benchmarking, Broken links.
Head to head


Momentum
New reviews each month
Review pace is the clearest public read on how fast an app is winning new merchants.
Free
- · Ask AI for quick answers (1/day)
- · Catch big spend shifts instantly
- · Connect 1 store
- · Get simple daily/weekly summaries
- · Track Shopify + Meta performance
Starter
- · Ask AI for quick summaries (5/day)
- · Connect Google Ads, TikTok, Google Ads
- · Connect Klaviyo
- · Get alerts before money is wasted
- · See which ads are driving ROAS and CTR
- · Spot underperforming landing pages early
Growth (Popular)
- · Ask AI to explain funnel issues (10/day)
- · Error alerts on site, UTM & checkout
- · Find out why conversions rise or fall
- · GA4 + Edgetag integrations
- · Protect tracking with server-side pixel
- · See where customers drop off in funnel
Professional
- · Ask AI for deep RCA (20/day)
- · Customer journey: first click to purchse
- · Everything in Growth, plus
- · Forecast dips with AI anomaly detection
- · POS + online sales in one view
- · See high-value bundles, checkout pattern
Coverage counts what each App Store listing names. Every feature, checked off app by app, is in Shoplist.
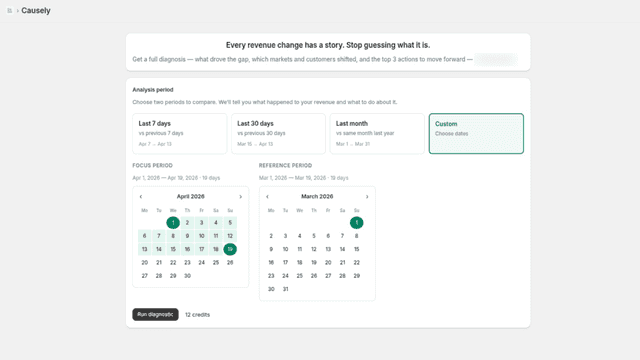
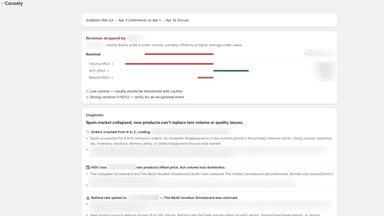
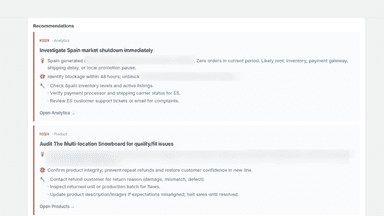
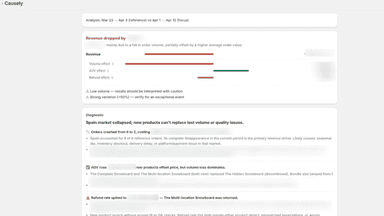
See every featureWhen your sales drop or spike, Causely tells you why — automatically. Connect your store and run an analysis in seconds. Causely breaks down your revenue change by channel, geography, customer segment, and product mix — so you know exactly where to focus to optimize your sales.
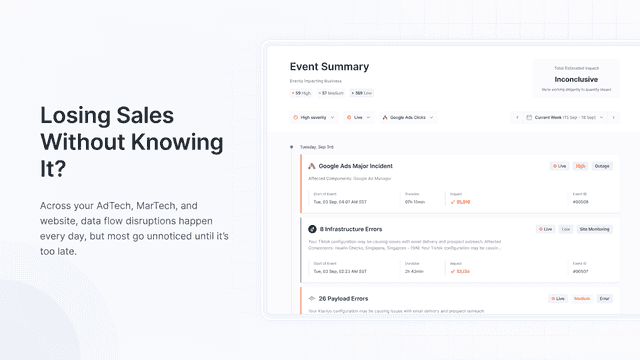
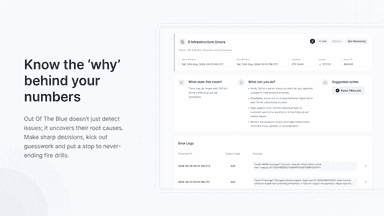
Most brands can't explain why ROAS drops. Metrics shift across Shopify, Meta, Google, and Klaviyo — but no single tool connects the dots or tells you why. Out of the Blue does. Built-in root-cause analysis identifies the likely driver across channels the moment performance changes — so your team acts in minutes, not days. Connects to 60+ data sources.
- Automated root cause analysis when revenue drops or spikes
- Deep diagnostic across channels, regions, segments and products
- Impact-focused recommendations tailored to your store's data and challenges
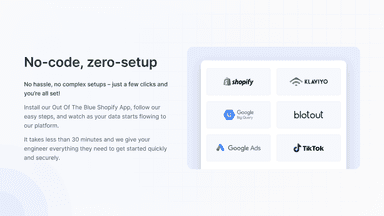
- One-click analysis — no setup, no dashboards to configure
- Real-Time Monitoring of your Shopify apps 24/7
- Uncover JavaScript code errors, broken images & network errors
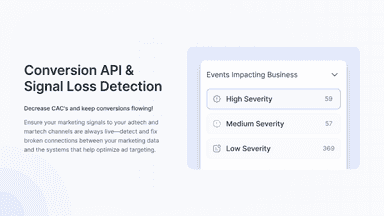
- Detect Broken or Missing Conversion Pixel
- Anomaly Detection in Store Metrics
All the numbers
Every figure, side by side
A green dot marks the app ahead on a measured figure. Estimates, gaps and apps that leave no storefront trace never take the lead.
Adoption
| Measure |  Causely |  ROAS Analytics & Alerts |
|---|---|---|
| Detected stores | Not published | Not published |
| Net store change, 28 days | 0 | 0 |
| Stores added, 28 days | Not enough data | Not enough data |
| Big-brand share | Not enough data | Not enough data |
| Top store categories | Not published | Not published |
| Top store countries | Not published | Not published |
Reviews
| Measure | Causely | ROAS Analytics & Alerts |
|---|---|---|
| App Store rating | Not published | 5.0 ★ |
| App Store reviews | Not published | 2 |
| New reviews, 28 days | Not enough data | Not enough data |
| Reviewers a year or more in | Not enough data | Not enough data |
Pricing
| Measure | Causely | ROAS Analytics & Alerts |
|---|---|---|
| Free plan | Not listed | Yes |
| Lowest paid monthly plan | No monthly plan listed | $199/month |
| Longest free trial | Not listed | 30 days |
| Plans listed | Not published | 4 |
Listing
| Measure | Causely | ROAS Analytics & Alerts |
|---|---|---|
| Shopify category rank | #1505 | #406(ahead) |
| Shopify App Charts | Not on this week’s charts | Not on this week’s charts |
| Built for Shopify | No | No |
| Launched | May 11, 2026 | Sep 10, 2024 |
| Languages | 1 | 1 |
| Developer | revelio | Out Of The Blue |
FAQ
Causely and ROAS Analytics & Alerts: common questions
- Is Causely or ROAS Analytics & Alerts cheaper?
- Only ROAS Analytics & Alerts lists a free plan. Shoplist compares base prices only between monthly plans in the same currency; usage charges and annual plans vary, so check each plan’s limits.
- What features does each app list that the other doesn’t?
- Causely lists 2 the others don’t mention, such as Abandoned cart, Segmentation. ROAS Analytics & Alerts lists 13 the others don’t mention, such as Activity tracking, Benchmarking, Broken links, Custom dashboards. A feature missing from a listing may still be supported; this compares what each App Store listing says.
- Where does this comparison’s data come from?
- Shoplist crawls Shopify storefronts to detect which apps each store runs, and reads each app’s Shopify App Store listing for reviews, pricing, features and integrations. Store counts are as of May 30, 2026 for Causely, Oct 29, 2026 for ROAS Analytics & Alerts; estimated figures are labeled.
How Shoplist compares apps
Store counts come from Shoplist’s crawl of Shopify storefronts, which detects the apps each store runs; they are as of May 30, 2026 for Causely, Oct 29, 2026 for ROAS Analytics & Alerts. Reviews, ratings, plans, features and integrations come from each app’s Shopify App Store listing. 28-day figures are labeled when estimated, and a figure that is missing or estimated never decides who leads. Read the methodology.