

Causely vs Daasity Reporting & Analytics
Two Shopify apps, side by side: detected stores, momentum, reviews, plans, listed features and who runs each. Store counts as of May 30, 2026 for Causely, Nov 7, 2026 for Daasity Reporting & Analytics.
The short answer
- Daasity Reporting & Analytics lists 15 features Causely’s listing doesn’t mention, including Cohort analysis, Custom dashboards, Data export.
Head to head


Momentum
New reviews each month
Review pace is the clearest public read on how fast an app is winning new merchants.
App Starting At:
- · Unify digital & retail data in one view.
Coverage counts what each App Store listing names. Every feature, checked off app by app, is in Shoplist.
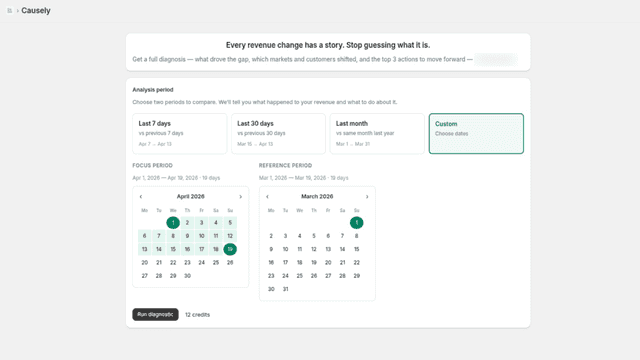
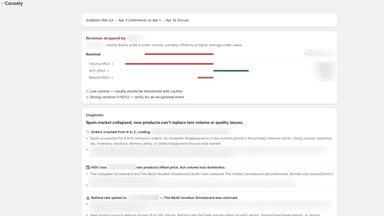
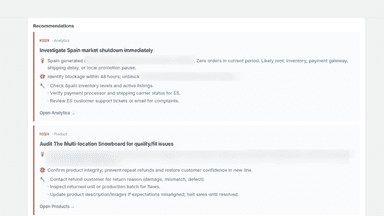
See every featureWhen your sales drop or spike, Causely tells you why — automatically. Connect your store and run an analysis in seconds. Causely breaks down your revenue change by channel, geography, customer segment, and product mix — so you know exactly where to focus to optimize your sales.
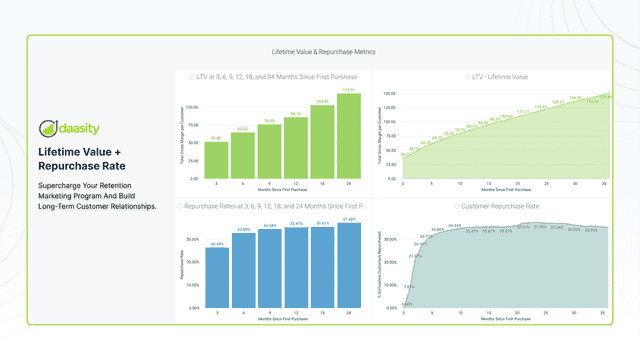
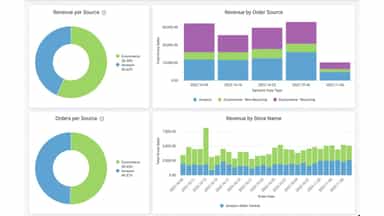
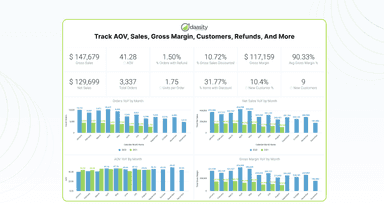
Brands don’t need another cost, they need solutions that drive revenue growth. Daasity exists to grow your revenue. Gain a complete view of your sales and profits across all channels, empowering you to act swiftly and strategically without the hassle of building complex tech stacks. Our platform combines the simplicity of an out of box system with the extensibility of a full customization.
- Automated root cause analysis when revenue drops or spikes
- Deep diagnostic across channels, regions, segments and products
- Impact-focused recommendations tailored to your store's data and challenges
- One-click analysis — no setup, no dashboards to configure
- Modularity: Use some or all of our ELT, Viz, & reverse ETL functionality
- First- and last-click plus Daasity attribution: customize your attribution logic
- Daasity Audiences: Push customer data to key marketing tools and channels
All the numbers
Every figure, side by side
A green dot marks the app ahead on a measured figure. Estimates, gaps and apps that leave no storefront trace never take the lead.
Adoption
| Measure |  Causely |  Daasity Reporting & Analytics |
|---|---|---|
| Detected stores | Not published | Not published |
| Net store change, 28 days | 0 | 0 |
| Stores added, 28 days | Not enough data | Not enough data |
| Big-brand share | Not enough data | Not enough data |
| Top store categories | Not published | Not published |
| Top store countries | Not published | Not published |
Reviews
| Measure | Causely | Daasity Reporting & Analytics |
|---|---|---|
| App Store rating | Not published | 4.7 ★ |
| App Store reviews | Not published | 52 |
| New reviews, 28 days | Not enough data | 0 |
| Reviewers a year or more in | Not enough data | Not enough data |
Pricing
| Measure | Causely | Daasity Reporting & Analytics |
|---|---|---|
| Free plan | Not listed | Not listed |
| Lowest paid monthly plan | No monthly plan listed | $1,899/month |
| Longest free trial | Not listed | 14 days |
| Plans listed | Not published | 1 |
Listing
| Measure | Causely | Daasity Reporting & Analytics |
|---|---|---|
| Shopify category rank | #1505 | #383(ahead) |
| Shopify App Charts | Not on this week’s charts | #12 on Featured by Shopify in Analytics |
| Built for Shopify | No | No |
| Launched | May 11, 2026 | May 13, 2020 |
| Languages | 1 | 1 |
| Developer | revelio | Daasity |
FAQ
Causely and Daasity Reporting & Analytics: common questions
- What features does each app list that the other doesn’t?
- Causely lists 2 the others don’t mention, such as Abandoned cart, AI insights. Daasity Reporting & Analytics lists 15 the others don’t mention, such as Cohort analysis, Custom dashboards, Data export, Forecasting. A feature missing from a listing may still be supported; this compares what each App Store listing says.
- Where does this comparison’s data come from?
- Shoplist crawls Shopify storefronts to detect which apps each store runs, and reads each app’s Shopify App Store listing for reviews, pricing, features and integrations. Store counts are as of May 30, 2026 for Causely, Nov 7, 2026 for Daasity Reporting & Analytics; estimated figures are labeled.
How Shoplist compares apps
Store counts come from Shoplist’s crawl of Shopify storefronts, which detects the apps each store runs; they are as of May 30, 2026 for Causely, Nov 7, 2026 for Daasity Reporting & Analytics. Reviews, ratings, plans, features and integrations come from each app’s Shopify App Store listing. 28-day figures are labeled when estimated, and a figure that is missing or estimated never decides who leads. Read the methodology.