
BrandOS vs Store Activity Change Log
Two Shopify apps, side by side: detected stores, momentum, reviews, plans, listed features and who runs each. Store counts as of Nov 13, 2026 for BrandOS, Oct 29, 2026 for Store Activity Change Log.
The short answer
- Paid plans start at $25/month for BrandOS and $14/month for Store Activity Change Log.
- Store Activity Change Log lists 10 features BrandOS’s listing doesn’t mention, including Cohort analysis, Custom dashboards, Custom reports.
Head to head

Momentum
New reviews each month
Review pace is the clearest public read on how fast an app is winning new merchants.
Decision Memory
- · Automatic product and discount tracking
- · Calendar of every store decision
- · Flag changes that overlap
- · Lessons from past results
- · Measure what happened to orders
- · Record why and who for each decision
Starter
- · 2 integrations included
- · Auto changelog for updates
- · Automatic AI Analysis
- · Connect multiple Meta Business Managers
- · Connect multiple Shopify stores
- · Custom metrics tracking
Pro
- · 5 integrations included
- · Auto changelog for updates
- · Automatic AI Analysis
- · Connect multiple Meta Business Managers
- · Connect multiple Shopify stores
- · Custom metrics tracking
Business
- · Auto changelog for updates
- · Automatic AI Analysis
- · Connect multiple Meta Business Managers
- · Connect multiple Shopify stores
- · Custom metrics tracking
- · Unlimited integrations included
Coverage counts what each App Store listing names. Every feature, checked off app by app, is in Shoplist.
See every featureBrands make dozens of commercial decisions every month and quickly lose track of why they were made and whether they worked. BrandOS automatically records important store changes, such as product updates, promotions and discount codes. It asks why each change was made and who made it, flags changes that overlap, then measures what happened to orders afterwards.
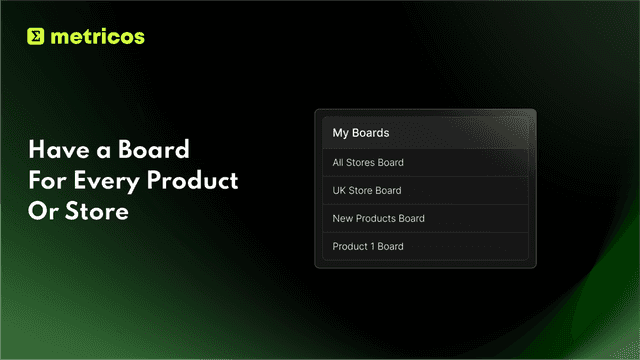
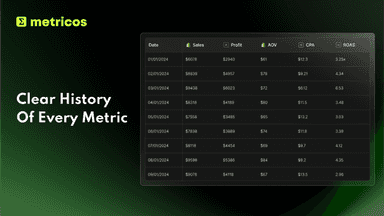
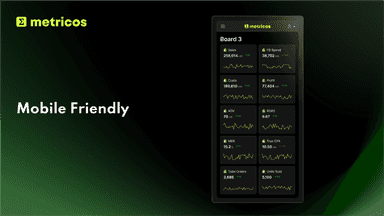
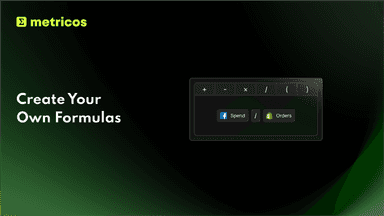
Automate your store activity change log with Metricos AI. Track theme edits, product updates and price changes alongside Facebook Ads and Google Ads launches, bids and campaign changes. Use Slack updates to follow selected custom metrics and events across multiple stores. Keep an activity log for marketing analytics and reduce missed updates between teams.
- Record product, promotion and discount changes automatically
- Capture why each change was made and who made it
- Flag changes that overlap, so results stay readable
- Measure what happened to orders after each decision
- Real-time Profit: Track net profit across all stores for instant insights
- Expenses Tracking: Monitor COGS, shipping, fees, taxes, and custom expenses
- Ad Spend Sync: Real-time data from Facebook, Google, TikTok, and more platforms
- Product & Marketing Analytics: Measure product-level and ad-level net profit
All the numbers
Every figure, side by side
A green dot marks the app ahead on a measured figure. Estimates, gaps and apps that leave no storefront trace never take the lead.
Adoption
| Measure |  Store Activity Change Log | |
|---|---|---|
| Detected stores | Not published | Not published |
| Net store change, 28 days | Not enough data | 0 |
| Stores added, 28 days | Not enough data | Not enough data |
| Big-brand share | Not enough data | Not enough data |
| Top store categories | Not published | Not published |
| Top store countries | Not published | Not published |
Reviews
| Measure | Store Activity Change Log | |
|---|---|---|
| App Store rating | Not published | 5.0 ★ |
| App Store reviews | Not published | 7 |
| New reviews, 28 days | Not enough data | Not enough data |
| Reviewers a year or more in | Not enough data | Not enough data |
Pricing
| Measure | Store Activity Change Log | |
|---|---|---|
| Free plan | Not listed | Not listed |
| Lowest paid monthly plan | $25/month | $14/month(ahead) |
| Longest free trial | 15 days | 14 days |
| Plans listed | 1 | 3 |
Listing
| Measure | Store Activity Change Log | |
|---|---|---|
| Shopify category rank | Not enough data | #504 |
| Shopify App Charts | Not on this week’s charts | Not on this week’s charts |
| Built for Shopify | No | No |
| Launched | Nov 13, 2026 | Aug 30, 2024 |
| Languages | 1 | 1 |
| Developer | BrandOS | The Shop Tinkerers |
FAQ
BrandOS and Store Activity Change Log: common questions
- Is BrandOS or Store Activity Change Log cheaper?
- Paid plans start at $25/month for BrandOS and $14/month for Store Activity Change Log. Shoplist compares base prices only between monthly plans in the same currency; usage charges and annual plans vary, so check each plan’s limits.
- What features does each app list that the other doesn’t?
- BrandOS lists 1 the others don’t mention, such as AI insights. Store Activity Change Log lists 10 the others don’t mention, such as Cohort analysis, Custom dashboards, Custom reports, Historical analysis. A feature missing from a listing may still be supported; this compares what each App Store listing says.
- Where does this comparison’s data come from?
- Shoplist crawls Shopify storefronts to detect which apps each store runs, and reads each app’s Shopify App Store listing for reviews, pricing, features and integrations. Store counts are as of Nov 13, 2026 for BrandOS, Oct 29, 2026 for Store Activity Change Log; estimated figures are labeled.
How Shoplist compares apps
Store counts come from Shoplist’s crawl of Shopify storefronts, which detects the apps each store runs; they are as of Nov 13, 2026 for BrandOS, Oct 29, 2026 for Store Activity Change Log. Reviews, ratings, plans, features and integrations come from each app’s Shopify App Store listing. 28-day figures are labeled when estimated, and a figure that is missing or estimated never decides who leads. Read the methodology.