

Blufire vs Margeny ‑ Profit Analytics
Two Shopify apps, side by side: detected stores, momentum, reviews, plans, listed features and who runs each. Store counts as of Nov 9, 2026 for Blufire, Nov 5, 2026 for Margeny.
The short answer
- Paid plans start at $1,050/month for Blufire and $29/month for Margeny.
- Blufire lists 9 features Margeny’s listing doesn’t mention, including Custom dashboards, Custom reports, Forecasting.
Head to head


- Australia
- New Zealand
Starter
- · Customer lifetime value & margins
- · Profit by product, category & channel
- · Revenue under $5M p.a
- · True contribution margin, every order
Growth
- · Everything in Starter
- · Revenue between $5M – $20M p.a
Pro
- · Everything in Growth
- · Revenue between $20M – $50M
Scale
- · Custom plans apply for rev. above 100M
- · Everything in Pro
- · Revenue greater than $50M-100M p.a
Starter
- · Customer LTV and cohorts
- · P&L with ad spend (Meta, Google, TikTok)
- · Profit per order: COGS,fees,shipping...
- · Up to 500 orders/month
- · Weekly profit report and anomaly alerts
Growth
- · Customer LTV and cohorts
- · P&L with ad spend (Meta, Google, TikTok)
- · Profit per order: COGS,fees,shipping...
- · Up to 2,500 orders/month
- · Weekly profit report and anomaly alerts
Scale
- · Customer LTV and cohorts
- · P&L with ad spend (Meta, Google, TikTok)
- · Profit per order: COGS,fees,shipping...
- · Up to 10,000 orders/month
- · Weekly profit report and anomaly alerts
Coverage counts what each App Store listing names. Every feature, checked off app by app, is in Shoplist.
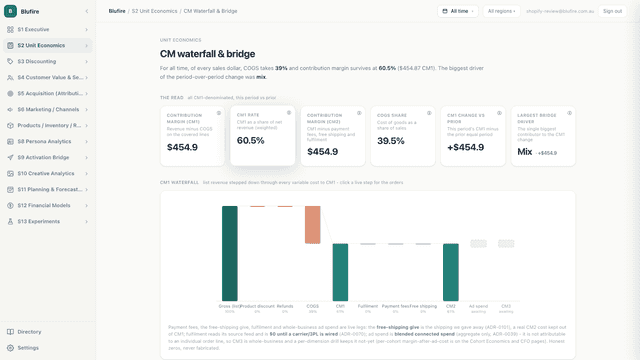
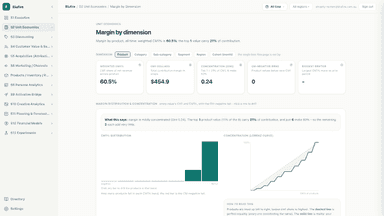
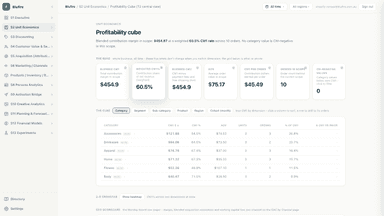
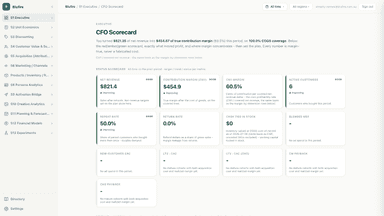
See every featureBlufire Analytics computes contribution margin for every order, product and customer by combining your Shopify revenue with cost of goods, shipping and payment fees. It shows profit at each level, not just top-line revenue, so you can see which products and customers make money after costs.
Most analytics tools show revenue, but revenue is not profit. Margeny calculates your actual profit by combining your Shopify orders with product costs, payment fees, shipping costs, refunds, and advertising spend from Meta, Google, and TikTok. Product costs are read automatically from Shopify.
- True contribution margin by order, product, category and customer
- Find products that lose money after shipping and fees
- Profit-based customer segments: high-margin, repeat, at-risk and new
- True profit per order: COGS, payment fees, shipping, and refunds included
- Daily P&L with Meta, Google, and TikTok ad spend, MER, and profit after ads
- Costs synced from Shopify, with per-variant overrides and bulk CSV upload
- Customer lifetime value, repeat rate, and cohort retention heatmap


All the numbers
Every figure, side by side
A green dot marks the app ahead on a measured figure. Estimates, gaps and apps that leave no storefront trace never take the lead.
Adoption
| Measure |  Blufire |  Margeny |
|---|---|---|
| Detected stores | 5 | Not published |
| Net store change, 28 days | 0 | 0 |
| Stores added, 28 days | Not enough data | Not enough data |
| Big-brand share | Not enough data | Not enough data |
| Top store categories | Food, Beverages & Tobacco, Apparel & Accessories, Furniture | Not published |
| Top store countries | Australia, New Zealand | Not published |
Reviews
| Measure | Blufire | Margeny |
|---|---|---|
| App Store rating | Not published | 5.0 ★ |
| App Store reviews | Not published | 3 |
| New reviews, 28 days | Not enough data | Not enough data |
| Reviewers a year or more in | Not enough data | Not enough data |
FAQ
Blufire and Margeny: common questions
- Is Blufire or Margeny cheaper?
- Paid plans start at $1,050/month for Blufire and $29/month for Margeny. Shoplist compares base prices only between monthly plans in the same currency; usage charges and annual plans vary, so check each plan’s limits.
- What features does each app list that the other doesn’t?
- Blufire lists 9 the others don’t mention, such as Custom dashboards, Custom reports, Forecasting, Loyalty analysis. Margeny lists 1 the others don’t mention, such as Data export. A feature missing from a listing may still be supported; this compares what each App Store listing says.
- Where does this comparison’s data come from?
- Shoplist crawls Shopify storefronts to detect which apps each store runs, and reads each app’s Shopify App Store listing for reviews, pricing, features and integrations. Store counts are as of Nov 9, 2026 for Blufire, Nov 5, 2026 for Margeny; estimated figures are labeled.
How Shoplist compares apps
Store counts come from Shoplist’s crawl of Shopify storefronts, which detects the apps each store runs; they are as of Nov 9, 2026 for Blufire, Nov 5, 2026 for Margeny. Reviews, ratings, plans, features and integrations come from each app’s Shopify App Store listing. 28-day figures are labeled when estimated, and a figure that is missing or estimated never decides who leads. Read the methodology.