
Bloom Profit Analytics vs TrackTrack
Two Shopify apps, side by side: detected stores, momentum, reviews, plans, listed features and who runs each. Store counts as of Nov 9, 2026.
The short answer
- Bloom Profit Analytics is detected on 51× as many Shopify stores as TrackTrack: 308 vs 6 as of Nov 9, 2026.
- Only Bloom Profit Analytics lists a free plan. Paid plans start at $20/month for Bloom Profit Analytics and $69/month for TrackTrack.
- TrackTrack lists 20 features Bloom Profit Analytics’s listing doesn’t mention, including Activity tracking, AI insights, Benchmarking.
Head to head


- United States
- United Kingdom
- Australia
- Indonesia
- United States
- Malaysia
Momentum
New reviews each month
Review pace is the clearest public read on how fast an app is winning new merchants.
Start
- · Ad platform Metrics (Meta & Google)
- · Cohort & Customer Metrics
- · Dashboard Overview
- · Fixed Cost Settings
- · Last 7 Days Data
- · Profit Table (Shopify)
Sprout
- · Bloom Pulse (Daily Insights)
- · Custom COGS & Shipping Cost
- · Detailed Profit & Loss Table
- · Marketing Metrics and Custom Settings
- · My Metrics & Email Summary
- · Order-Level Profit
Grow
- · All in Sprout Plan
- · Amazon Profit & Loss
- · CLTV, Custom Dashboard
- · Claude & ChatGPT MCP
- · Email Campaign Profits
- · Goals, Targets and Shopify Markets
Flourish
- · Ad Intelligence (coming soon)
- · All in Grow Plan
- · Ask Bloom (AI Insights)
- · Channel Profits
- · Country-Level ROAS & Profits
- · Marketing Attribution/ Campaign Analysis
Standard
- · Auto-track actions to sales & profit
- · Compare history to estimate impact
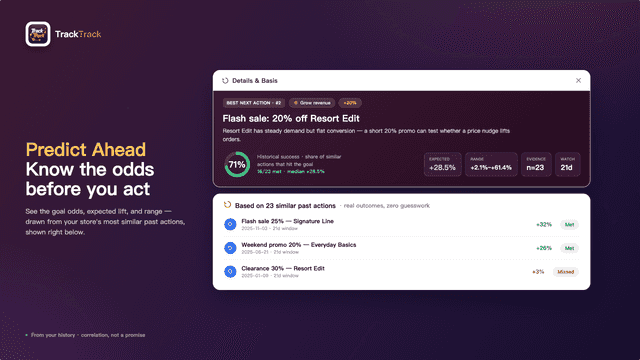
- · Predict an action's odds before you act
- · Recommended next actions to test
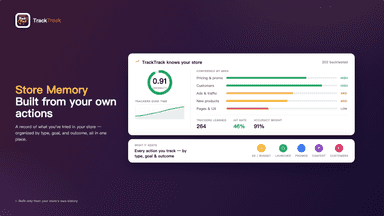
- · Store memory learns what works for you
- · Track ads, launches, pages, offers
Coverage counts what each App Store listing names. Every feature, checked off app by app, is in Shoplist.
See every featureBloom tracks real time profit you keep after COGS, shipping, ad spend, and expenses across Shopify and Amazon with a clean dashboard and breakdown, so you know what is growing or draining your business. See profit performance across orders, products, and campaigns, with AI insights that tell you what to scale, fix or cut. Track which channels drive profitable sales, not just conversions, and know POAS.
TrackTrack shows which store actions paid off and what to do next. It detects and auto-tracks changes like ad budgets, product launches, offers, and campaigns, and lets you add any action with its decision, reason, and expected result. Each action is linked to orders, revenue, profit, and ad performance, so you can see what worked, compare similar past actions, and estimate sales, profit, and goal success.
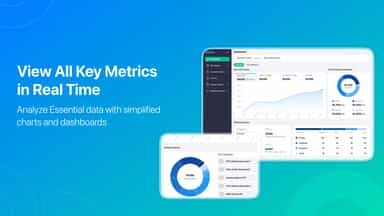
- Profit Analytics: Understand & track what drives your store's sales & net profit
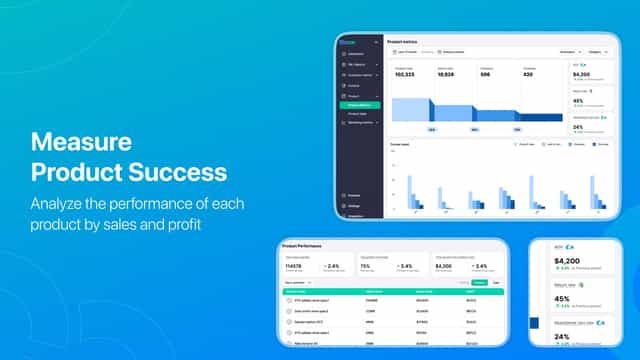
- Product Metrics: Track product journey from 'page views' to 'carts' to 'sales'
- Expense Tracker: Simplified tracking system for a more accurate profit analysis
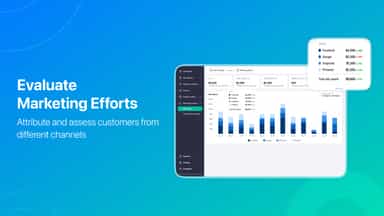
- Marketing & Ads: Get consolidated ROAS and POAS from ad spend across channels
- Auto-track ad, launch, promo, and traffic changes — or log any action manually.
- Link each action to orders, revenue, profit, costs, and customer/source signals.
- See which budget changes, offers, partnerships, and campaigns improved profit.
- Build a store memory that gets sharper the more you use it.



All the numbers
Every figure, side by side
A green dot marks the app ahead on a measured figure. Estimates, gaps and apps that leave no storefront trace never take the lead.
Adoption
| Measure |  Bloom Profit Analytics |  TrackTrack |
|---|---|---|
| Detected stores | 308(ahead) | 6 |
| Net store change, 28 days | +4 | 0 |
| Stores added, 28 days | 10 | Not enough data |
| Big-brand share | 30% | Not enough data |
| Top store categories | Apparel & Accessories, Health & Beauty, Home & Garden | Apparel & Accessories |
| Top store countries | United States, United Kingdom, Australia | Indonesia, United States, Malaysia |
Reviews
| Measure | Bloom Profit Analytics | TrackTrack |
|---|---|---|
| App Store rating | 5.0 ★ | Not published |
| App Store reviews | 47 | Not published |
| New reviews, 28 days | Not enough data | Not enough data |
| Reviewers a year or more in | 5% | Not enough data |
Pricing
| Measure | Bloom Profit Analytics | TrackTrack |
|---|---|---|
| Free plan | Yes | Not listed |
| Lowest paid monthly plan | $20/month(ahead) | $69/month |
| Longest free trial | 14 days | Not listed |
| Plans listed | 4 | 1 |
Listing
| Measure | Bloom Profit Analytics | TrackTrack |
|---|---|---|
| Shopify category rank | #35(ahead) | #475 |
| Shopify App Charts | #4 on Pricing moves in Analytics | Not on this week’s charts |
| Built for Shopify | No | No |
| Launched | Oct 15, 2024 | Jul 2, 2026 |
| Languages | 1 | 1 |
| Developer | Estore Automate | Wesmond International Limited |
FAQ
Bloom Profit Analytics and TrackTrack: common questions
- Which is more popular, Bloom Profit Analytics or TrackTrack?
- Bloom Profit Analytics is detected on 51× as many Shopify stores as TrackTrack: 308 vs 6 as of Nov 9, 2026.
- Is Bloom Profit Analytics or TrackTrack cheaper?
- Only Bloom Profit Analytics lists a free plan. Paid plans start at $20/month for Bloom Profit Analytics and $69/month for TrackTrack. Shoplist compares base prices only between monthly plans in the same currency; usage charges and annual plans vary, so check each plan’s limits.
- What features does each app list that the other doesn’t?
- TrackTrack lists 20 the others don’t mention, such as Activity tracking, AI insights, Benchmarking, Broken links. A feature missing from a listing may still be supported; this compares what each App Store listing says.
- Where does this comparison’s data come from?
- Shoplist crawls Shopify storefronts to detect which apps each store runs, and reads each app’s Shopify App Store listing for reviews, pricing, features and integrations. Store counts are as of Nov 9, 2026; estimated figures are labeled.
How Shoplist compares apps
Store counts come from Shoplist’s crawl of Shopify storefronts, which detects the apps each store runs; they are as of Nov 9, 2026. Reviews, ratings, plans, features and integrations come from each app’s Shopify App Store listing. 28-day figures are labeled when estimated, and a figure that is missing or estimated never decides who leads. Read the methodology.