

BR ‑ Better Reports vs Reporting SaaS: Profit Report
Two Shopify apps, side by side: detected stores, momentum, reviews, plans, listed features and who runs each. Store counts as of Nov 5, 2026 for BR, Oct 13, 2026 for Reporting SaaS.
The short answer
- Paid plans start at $19.90/month for BR and $7.99/month for Reporting SaaS.
- BR lists 33 features Reporting SaaS’s listing doesn’t mention, including Cash flow, COGS tracking, Cohort analysis.
Head to head


Reports of your sales, customers, inventory, COGS and more.
Momentum
New reviews each month
Review pace is the clearest public read on how fast an app is winning new merchants.
Basic
- · Built-in reports
- · Custom reports and fields
- · Export to PDF, Excel, CSV, Google Sheets
- · Free custom report service
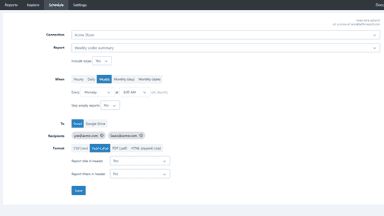
- · Schedule automatic reports
Grow
- · Built-in reports
- · Custom reports and fields
- · Export to PDF, Excel, CSV, Google Sheets
- · Free custom report service
- · Schedule automatic reports
Advanced
- · Built-in reports
- · Custom reports and fields
- · Export to PDF, Excel, CSV, Google Sheets
- · Free custom report service
- · Schedule automatic reports
Plus
- · Built-in reports
- · Custom reports and fields
- · Export to PDF, Excel, CSV, Google Sheets
- · Free custom report service
- · Schedule automatic reports
Standard
- · 3 extra recipients
- · Daily, weekly or monthly PDF by email
- · End-of-month revenue projection
- · PDF, CSV and Excel with payouts
- · Real margin per product
- · Sales drop and slowing product alerts
Coverage counts what each App Store listing names. Every feature, checked off app by app, is in Shoplist.
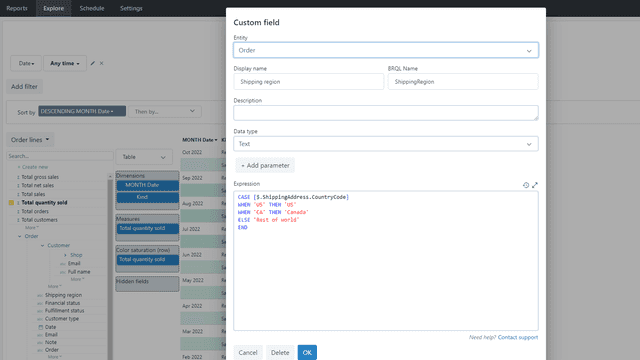
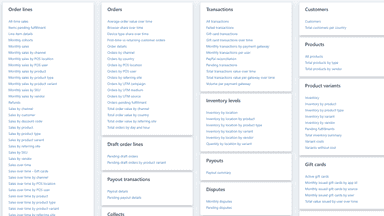
See every featureAnalyze your sales, payments, inventory, customers, payouts and more. There are numerous pre-built reports. You can also create custom reports, or let us do it for you. Slice and dice your data with custom fields, metrics and formulas. Once you have the perfect report, you can export it, or have it emailed to your team automatically.
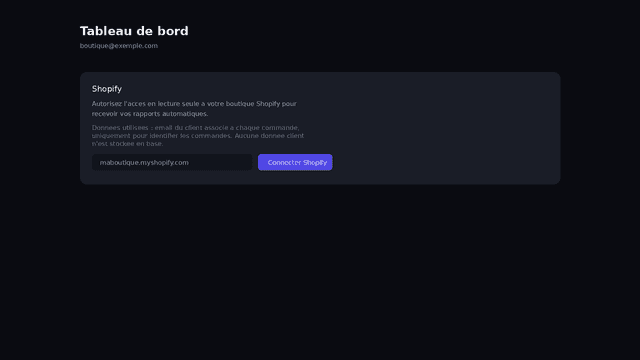
Shopify shows that revenue changed. Reporting SaaS tells you why, and what you actually kept. It uses the cost per item set in Shopify to show your real margin per product after discounts and refunds. Add your monthly marketing budget to see profit after marketing. When discounts, refunds or cancellations run unusually high, the report puts a figure on the loss, names the cause and suggests an action.
- Explore all your store data (including tags, metafields, attributes and more).
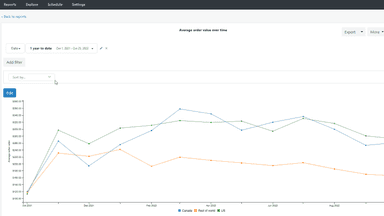
- Custom reports and metrics. Multiple chart visuals.
- Complimentary report service. Let us build your custom reports for you.
- Share and export your reports to PDF, Excel, CSV, Google Sheets.
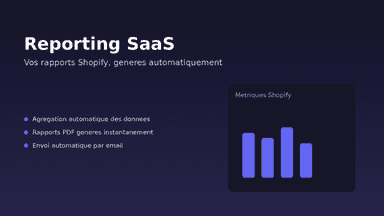
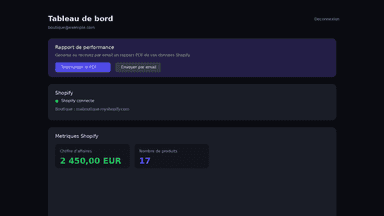
- Agregation automatique de vos donnees de commandes et produits
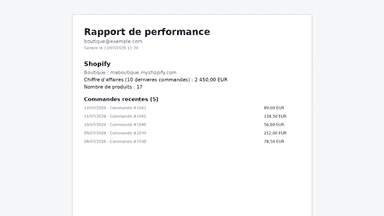
- Generation de rapports PDF clairs et prets a partager
- Envoi automatique de vos rapports directement par email
All the numbers
Every figure, side by side
A green dot marks the app ahead on a measured figure. Estimates, gaps and apps that leave no storefront trace never take the lead.
Adoption
| Measure |  BR |  Reporting SaaS |
|---|---|---|
| Detected stores | Not published | Not published |
| Net store change, 28 days | 0 | 0 |
| Stores added, 28 days | Not enough data | Not enough data |
| Big-brand share | Not enough data | Not enough data |
| Top store categories | Not published | Not published |
| Top store countries | Not published | Not published |
Reviews
| Measure | BR | Reporting SaaS |
|---|---|---|
| App Store rating | 5.0 ★ | Not published |
| App Store reviews | 1,200 | Not published |
| New reviews, 28 days | 0 | Not enough data |
| Reviewers a year or more in | 50% | Not enough data |
Pricing
| Measure | BR | Reporting SaaS |
|---|---|---|
| Free plan | Not listed | Not listed |
| Lowest paid monthly plan | $19.90/month | $7.99/month(ahead) |
| Longest free trial | 14 days | 30 days |
| Plans listed | 4 | 1 |
Listing
| Measure | BR | Reporting SaaS |
|---|---|---|
| Shopify category rank | #12 | #1352 |
| Shopify App Charts | #5 on Featured by Shopify in Accounting | Not on this week’s charts |
| Built for Shopify | No | No |
| Launched | Feb 24, 2017 | Jul 15, 2026 |
| Languages | 1 | 1 |
| Developer | Better Reports Technologies | Reporting SaaS |
FAQ
BR and Reporting SaaS: common questions
- Is BR or Reporting SaaS cheaper?
- Paid plans start at $19.90/month for BR and $7.99/month for Reporting SaaS. Shoplist compares base prices only between monthly plans in the same currency; usage charges and annual plans vary, so check each plan’s limits.
- What features does each app list that the other doesn’t?
- BR lists 33 the others don’t mention, such as Cash flow, COGS tracking, Cohort analysis, Custom dashboards. A feature missing from a listing may still be supported; this compares what each App Store listing says.
- Where does this comparison’s data come from?
- Shoplist crawls Shopify storefronts to detect which apps each store runs, and reads each app’s Shopify App Store listing for reviews, pricing, features and integrations. Store counts are as of Nov 5, 2026 for BR, Oct 13, 2026 for Reporting SaaS; estimated figures are labeled.
How Shoplist compares apps
Store counts come from Shoplist’s crawl of Shopify storefronts, which detects the apps each store runs; they are as of Nov 5, 2026 for BR, Oct 13, 2026 for Reporting SaaS. Reviews, ratings, plans, features and integrations come from each app’s Shopify App Store listing. 28-day figures are labeled when estimated, and a figure that is missing or estimated never decides who leads. Read the methodology.