
BASE Conversions vs CD: Profit Analytics & Reports
Two Shopify apps, side by side: detected stores, momentum, reviews, plans, listed features and who runs each. Store counts as of Nov 9, 2026.
The short answer
- CD is detected on 17× as many Shopify stores as BASE Conversions: 17 vs 1 as of Nov 9, 2026.
- CD lists 17 features BASE Conversions’s listing doesn’t mention, including Analytics dashboard, Cash flow, COGS tracking.
Head to head


- United Kingdom
- Australia
- Spain
- Germany
Momentum
New reviews each month
Review pace is the clearest public read on how fast an app is winning new merchants.
Awesome
- · Best-in-class shipping calculations
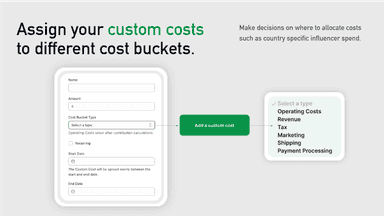
- · Custom Rules
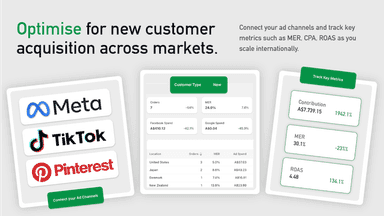
- · Google & Meta Connector
- · Multi-Country Analysis
- · Unlimited Orders
Coverage counts what each App Store listing names. Every feature, checked off app by app, is in Shoplist.
See every featureBASE Conversion optimises your Amazon Ads performance by automating data sync via CAPI and Amazon Ad Tag. Connect your store to Amazon DSP to drive accurate attribution and build powerful custom audiences. Leverage AWS Clean Rooms (AMC) to unlock deep, privacy-safe insights into the customer journey without technical setup.
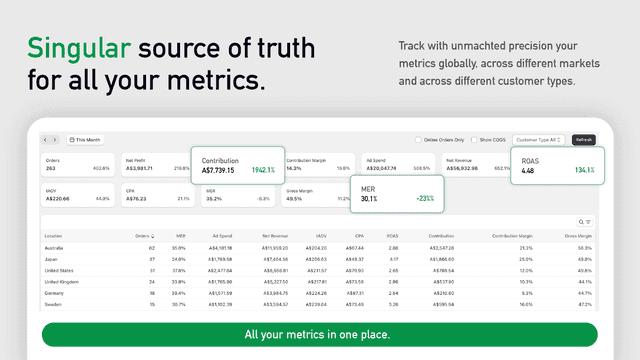
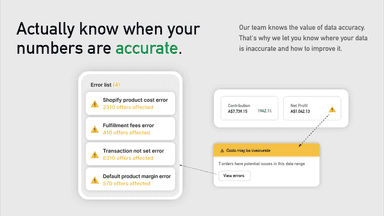
Turn data into dollars with an analytics dashboard that integrates with your marketing platforms, giving you the insights to optimize your advertising ROI, identify your most profitable products and markets, and make data-driven decisions that boost your bottom line.
- Using the Conversions API to send data to Amazon Ads
- Automatically deploy the Amazon Ad Tag to share events such as page views
- Customise events with advanced settings
- Dollar-Perfect Profit Tracking
- Track marketing spend with ease.
- Breakdown *all* metrics by region


All the numbers
Every figure, side by side
A green dot marks the app ahead on a measured figure. Estimates, gaps and apps that leave no storefront trace never take the lead.
Adoption
| Measure |  CD | |
|---|---|---|
| Detected stores | 1 | 17(ahead) |
| Net store change, 28 days | 0 | 0 |
| Stores added, 28 days | Not enough data | Not enough data |
| Big-brand share | Not enough data | Not enough data |
| Top store categories | Food, Beverages & Tobacco | Apparel & Accessories, Food, Beverages & Tobacco, Home & Garden |
| Top store countries | United Kingdom | Australia, Spain, Germany |
Reviews
| Measure | CD | |
|---|---|---|
| App Store rating | Not published | 5.0 ★ |
| App Store reviews | Not published | 5 |
| New reviews, 28 days | Not enough data | 0 |
| Reviewers a year or more in | Not enough data | Not enough data |
Pricing
| Measure | CD | |
|---|---|---|
| Free plan | Not listed | Not listed |
| Lowest paid monthly plan | No monthly plan listed | $5.99/month |
| Longest free trial | Not listed | 14 days |
| Plans listed | Not published | 1 |
Listing
| Measure | CD | |
|---|---|---|
| Shopify category rank | Not enough data | #669 |
| Shopify App Charts | #25 in Advertising - Other | Not on this week’s charts |
| Built for Shopify | No | No |
| Launched | Feb 6, 2026 | Feb 5, 2024 |
| Languages | 1 | 1 |
| Developer | BASE Commerce Media LTD | CashDash |
FAQ
BASE Conversions and CD: common questions
- Which is more popular, BASE Conversions or CD?
- CD is detected on 17× as many Shopify stores as BASE Conversions: 17 vs 1 as of Nov 9, 2026.
- What features does each app list that the other doesn’t?
- CD lists 17 the others don’t mention, such as Analytics dashboard, Cash flow, COGS tracking, Custom dashboards. A feature missing from a listing may still be supported; this compares what each App Store listing says.
- Where does this comparison’s data come from?
- Shoplist crawls Shopify storefronts to detect which apps each store runs, and reads each app’s Shopify App Store listing for reviews, pricing, features and integrations. Store counts are as of Nov 9, 2026; estimated figures are labeled.
How Shoplist compares apps
Store counts come from Shoplist’s crawl of Shopify storefronts, which detects the apps each store runs; they are as of Nov 9, 2026. Reviews, ratings, plans, features and integrations come from each app’s Shopify App Store listing. 28-day figures are labeled when estimated, and a figure that is missing or estimated never decides who leads. Read the methodology.