

Attronaut Analytics vs Potential Commerce Ads Center
Two Shopify apps, side by side: detected stores, momentum, reviews, plans, listed features and who runs each. Store counts as of Feb 19, 2026 for Attronaut Analytics, Oct 13, 2026 for Potential Commerce Ads Center.
The short answer
- Potential Commerce Ads Center lists 9 features Attronaut Analytics’s listing doesn’t mention, including Click-through rates, Conversion tracking, Cost per acquisition.
Head to head


Momentum
New reviews each month
Review pace is the clearest public read on how fast an app is winning new merchants.
Starter
- · 100 Insights runs/mo
- · Goal-based performance views
- · Meta ads connection
- · Self-serve setup, No Pixel or Store Code
- · Shopify order analysis
Coverage counts what each App Store listing names. Every feature, checked off app by app, is in Shoplist.
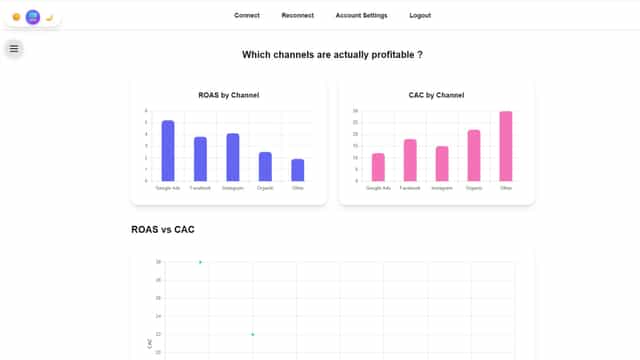
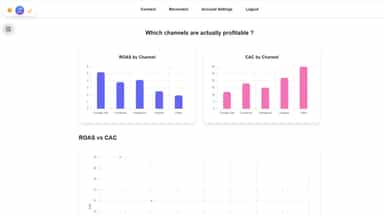
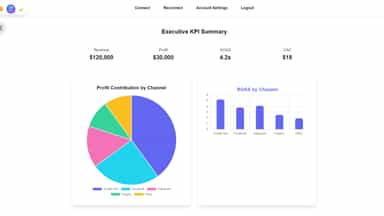
See every featureAttronaut Analytics helps merchants understand their marketing performance by centralizing key ad metrics like revenue, ROAS, CAC, and ad spend. The app connects with Google Ads and Shopify to provide actionable insights in one place. Merchants can monitor campaign performance, identify trends, and make data-driven decisions to optimize their advertising strategies.
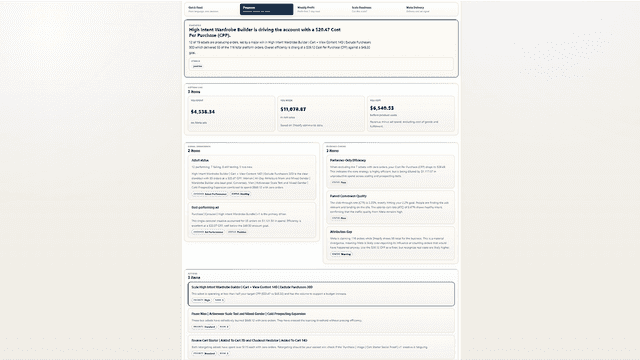
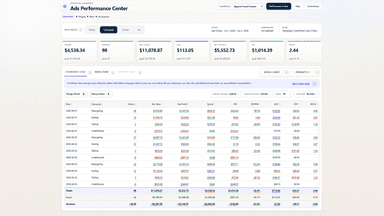
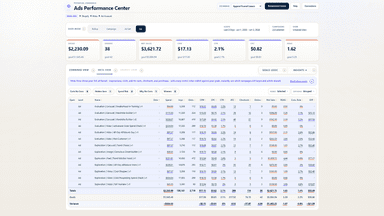
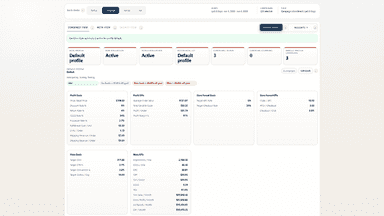
Potential Commerce Ads Performance Center connects Meta ad performance with Store order data so merchants can see spend, sales, ROAS, CPA, and attribution in one place. Compare campaigns, ad sets, and ads against your own business goals, then use AI-assisted insights to spot wasted spend, identify winners, and decide what to review next.
- Track ad spend, revenue, and ROAS from Google Ads and Shopify in one dashboard
- Get hourly synced analytics data for accurate performance tracking
- Compare CAC vs ROAS to optimize advertising and marketing strategies
- Connect Meta ad spend with Store order performance.
- Compare ROAS, CPA, spend, sales, and orders against your goals.
- Use AI-assisted insights to find winners and wasted spend.
- Review campaign, ad set, and ad performance in one table.
All the numbers
Every figure, side by side
A green dot marks the app ahead on a measured figure. Estimates, gaps and apps that leave no storefront trace never take the lead.
Adoption
| Measure |  Attronaut Analytics |  Potential Commerce Ads Center |
|---|---|---|
| Detected stores | Not published | Not published |
| Net store change, 28 days | 0 | 0 |
| Stores added, 28 days | Not enough data | Not enough data |
| Big-brand share | Not enough data | Not enough data |
| Top store categories | Not published | Not published |
| Top store countries | Not published | Not published |
Reviews
| Measure | Attronaut Analytics | Potential Commerce Ads Center |
|---|---|---|
| App Store rating | Not published | 5.0 ★ |
| App Store reviews | Not published | 2 |
| New reviews, 28 days | Not enough data | Not enough data |
| Reviewers a year or more in | Not enough data | Not enough data |
Pricing
| Measure | Attronaut Analytics | Potential Commerce Ads Center |
|---|---|---|
| Free plan | Not listed | Not listed |
| Lowest paid monthly plan | No monthly plan listed | $39/month |
| Longest free trial | Not listed | 7 days |
| Plans listed | Not published | 1 |
Listing
| Measure | Attronaut Analytics | Potential Commerce Ads Center |
|---|---|---|
| Shopify category rank | #382 | #189(ahead) |
| Shopify App Charts | Not on this week’s charts | Not on this week’s charts |
| Built for Shopify | No | No |
| Launched | Sep 19, 2025 | Jun 3, 2026 |
| Languages | 1 | 1 |
| Developer | Attronaut | Emojico Inc. DBA Potential Commerce |
FAQ
Attronaut Analytics and Potential Commerce Ads Center: common questions
- What features does each app list that the other doesn’t?
- Attronaut Analytics lists 1 the others don’t mention, such as A/B testing. Potential Commerce Ads Center lists 9 the others don’t mention, such as Click-through rates, Conversion tracking, Cost per acquisition, Dashboards. A feature missing from a listing may still be supported; this compares what each App Store listing says.
- Where does this comparison’s data come from?
- Shoplist crawls Shopify storefronts to detect which apps each store runs, and reads each app’s Shopify App Store listing for reviews, pricing, features and integrations. Store counts are as of Feb 19, 2026 for Attronaut Analytics, Oct 13, 2026 for Potential Commerce Ads Center; estimated figures are labeled.
How Shoplist compares apps
Store counts come from Shoplist’s crawl of Shopify storefronts, which detects the apps each store runs; they are as of Feb 19, 2026 for Attronaut Analytics, Oct 13, 2026 for Potential Commerce Ads Center. Reviews, ratings, plans, features and integrations come from each app’s Shopify App Store listing. 28-day figures are labeled when estimated, and a figure that is missing or estimated never decides who leads. Read the methodology.