

Attrify vs LyftAI — AI Analytics & Growth
Two Shopify apps, side by side: detected stores, momentum, reviews, plans, listed features and who runs each. Store counts as of Nov 8, 2026 for Attrify, Oct 13, 2026 for LyftAI.
The short answer
Head to head


- Hong Kong
- South Africa
- United States
Starter Plan
- · 2 team seats
- · AI Website Scanner (CRO)
- · AI marketing agents
- · All tools included — analytics, AI agent
- · KPI Brain — daily AI read
- · Meta & Google Ads analytic
Growth Plan
- · 24-month data history
- · 5 team seats
- · Ad-level Meta Detail + creative-fatigue
- · Competitor & price intelligence
- · Everything in Starter, plus
- · Extended Creative Lab (AI)
Scale Plan
- · 2,000–7,000 orders/month
- · Incrementality (MMM-lite) + LTV : CAC
- · Inventory &productlevel P&L intelligence
- · Maximum Creative Lab (AI)
- · Performance Agent AI — proactive actions
- · Unlimited data history
Coverage counts what each App Store listing names. Every feature, checked off app by app, is in Shoplist.
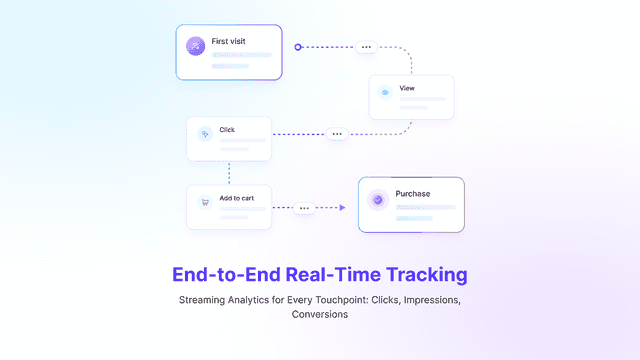
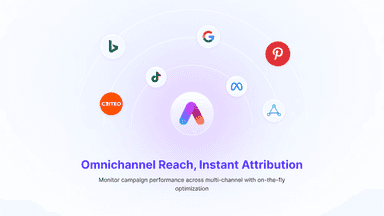
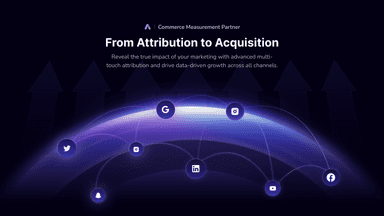
See every featureIn an era of data silos and tightening privacy policies, ecommerce brands face inaccurate attribution, inflated ROAS, and fragmented customer journeys. Attrify Full-Funnel Attribution is built on first-party data, using Multi-Touch Attribution to restore true Customer Journey visibility and ensure every dollar of ad spend goes to touchpoints that actually drive incremental value.【FREE BETA】Early adopters get access…
LyftAI unifies your store data into a single AI-driven analytics workspace. • Accurate sales KPIs: revenue net of refunds, AOV, orders, new vs returning customers • Lifetime value, cohorts and retention • Attribution and performance (connect Meta, GA4, Klaviyo separately) • An AI team (CEO, CFO, Ads, CRO, Data…) that analyzes your data and answers your questions • Automatic reports and PDF export 100% read-only —…
- Attribute upper-funnel ads revenue using infinite lookback windows.
- Map the complete customer journey and identify key behavioral touchpoints.
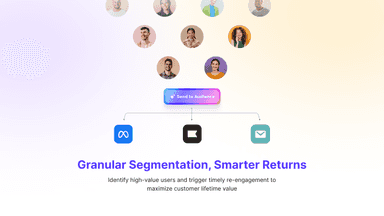
- Boost profitability by acquiring customer LTV through precise targeting
- Sales KPIs net of refunds: revenue, AOV, orders, new vs returning customers Life
- Lifetime value, cohort and retention analysis for your customers
- AI assistants that read your data and answer questions in chat or voice
- Automatic performance reports with one-click PDF export



All the numbers
Every figure, side by side
A green dot marks the app ahead on a measured figure. Estimates, gaps and apps that leave no storefront trace never take the lead.
Adoption
| Measure |  Attrify |  LyftAI |
|---|---|---|
| Detected stores | 6 | Not published |
| Net store change, 28 days | 0 | 0 |
| Stores added, 28 days | Not enough data | Not enough data |
| Big-brand share | Not enough data | Not enough data |
| Top store categories | Apparel & Accessories, Business & Industrial, Health & Beauty | Not published |
| Top store countries | Hong Kong, South Africa, United States | Not published |
Reviews
| Measure | Attrify | LyftAI |
|---|---|---|
| App Store rating | Not published | Not published |
| App Store reviews | Not published | Not published |
| New reviews, 28 days | Not enough data | Not enough data |
| Reviewers a year or more in | Not enough data | Not enough data |
FAQ
Attrify and LyftAI: common questions
- Where does this comparison’s data come from?
- Shoplist crawls Shopify storefronts to detect which apps each store runs, and reads each app’s Shopify App Store listing for reviews, pricing, features and integrations. Store counts are as of Nov 8, 2026 for Attrify, Oct 13, 2026 for LyftAI; estimated figures are labeled.
How Shoplist compares apps
Store counts come from Shoplist’s crawl of Shopify storefronts, which detects the apps each store runs; they are as of Nov 8, 2026 for Attrify, Oct 13, 2026 for LyftAI. Reviews, ratings, plans, features and integrations come from each app’s Shopify App Store listing. 28-day figures are labeled when estimated, and a figure that is missing or estimated never decides who leads. Read the methodology.