
Arka: Smart Analyzer vs DOE Labs
Two Shopify apps, side by side: detected stores, momentum, reviews, plans, listed features and who runs each. Store counts as of May 22, 2026 for Arka, Nov 5, 2026 for DOE Labs.
The short answer
- Only DOE Labs lists a free plan.
- DOE Labs lists 3 features Arka’s listing doesn’t mention, including Analytics dashboard, Checkout analytics, Purchase tracking.
Head to head


FREE
- · Ad performance and ROAS dashboards
- · Cohort reports
- · Custom reports
- · Customer lifetime value (LTV) insights
- · Google Ads, Meta Ads, GA, Klaviyo, Skio
- · Profit and loss reporting
Starter
- · 51 to 500 orders per month
- · Ad performance and ROAS dashboards
- · Cohort reports
- · Custom reports
- · Customer lifetime value (LTV) insights
- · Google Ads, Meta Ads, GA, Klaviyo, Skio
Growth
- · 501 to 3,000 orders per month
- · Ad performance and ROAS dashboards
- · Cohort reports
- · Custom reports
- · Customer lifetime value (LTV) insights
- · Google Ads, Meta Ads, GA, Klaviyo, Skio
Scale
- · 3,001 to 10,000 orders per month
- · Ad performance and ROAS dashboards
- · Cohort reports
- · Custom reports
- · Customer lifetime value (LTV) insights
- · Google Ads, Meta Ads, GA, Klaviyo, Skio
Pro
- · 10,001 to 15,000 orders per month
- · Ad performance and ROAS dashboards
- · Cohort reports
- · Custom Reports
- · Customer lifetime value (LTV) insights
- · Google Ads, Meta Ads, GA, Klaviyo, Skio
Elite
- · 15,001 to 25,000 orders per month
- · Ad performance and ROAS dashboards
- · Cohort reports
- · Custom reports
- · Customer lifetime value (LTV) insights
- · Google Ads, Meta Ads, GA, Klaviyo, Skio
Enterprise
- · 25,001+ orders per month
- · Ad performance and ROAS dashboards
- · Cohort reports
- · Custom reports
- · Customer lifetime value (LTV) insights
- · Google Ads, Meta Ads, GA, Klaviyo, Skio
Coverage counts what each App Store listing names. Every feature, checked off app by app, is in Shoplist.
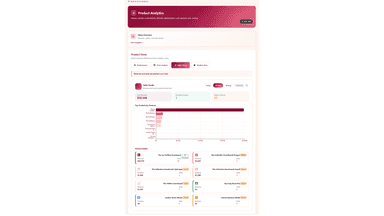
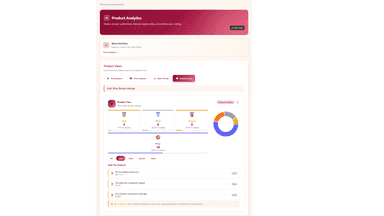
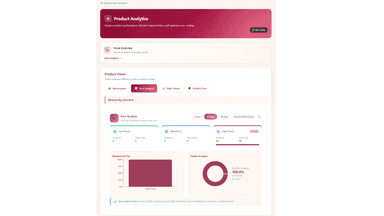
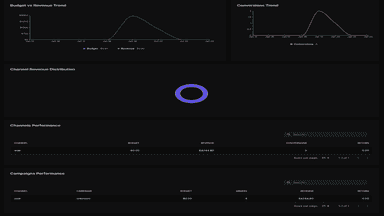
See every featureArka: Smart Analyzer provides an embedded analytics dashboard inside Shopify admin. It summarizes sales performance, funnels, and trends from order history. On the product side, it highlights top and underperforming products, tier breakdowns, and abandonment indicators. Use the dashboards to spot changes, compare periods, and decide what to optimize next without exporting spreadsheets.
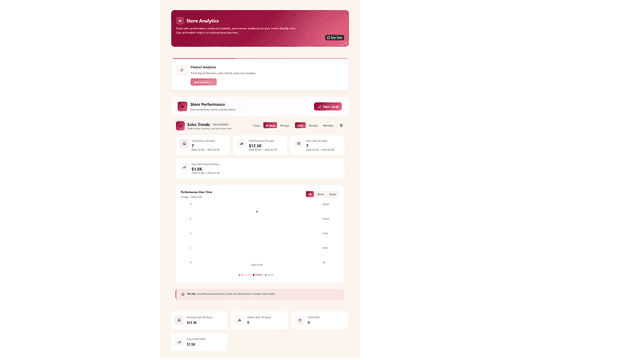
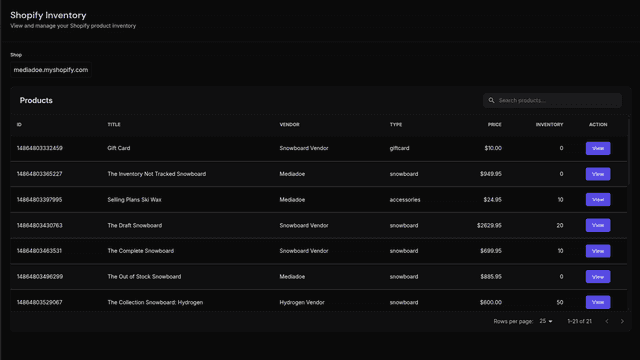
DOE Labs transforms ecommerce data into clear, actionable business intelligence. Bring your Shopify store and marketing data together to evaluate campaign effectiveness, understand sales trends, and uncover opportunities for growth.
- Product performance, tiers
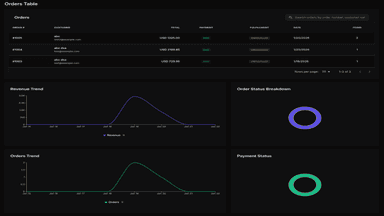
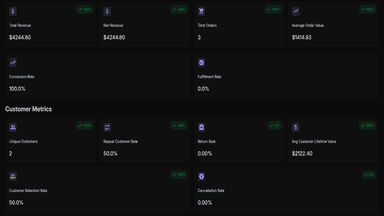
- Sales trends, funnel views, and store KPI dashboard
- Insight on sales Analytics.
- Sales and order analytics dashboards for clear performance tracking
- Customer insights including purchase behavior and order history
- Read-only reports for products, revenue trends, and store activity
All the numbers
Every figure, side by side
A green dot marks the app ahead on a measured figure. Estimates, gaps and apps that leave no storefront trace never take the lead.
Adoption
| Measure |  Arka |  DOE Labs |
|---|---|---|
| Detected stores | Not published | Not published |
| Net store change, 28 days | 0 | 0 |
| Stores added, 28 days | Not enough data | Not enough data |
| Big-brand share | Not enough data | Not enough data |
| Top store categories | Not published | Not published |
| Top store countries | Not published | Not published |
Reviews
| Measure | Arka | DOE Labs |
|---|---|---|
| App Store rating | Not published | Not published |
| App Store reviews | Not published | Not published |
| New reviews, 28 days | Not enough data | Not enough data |
| Reviewers a year or more in | Not enough data | Not enough data |
FAQ
Arka and DOE Labs: common questions
- Is Arka or DOE Labs cheaper?
- Only DOE Labs lists a free plan. Shoplist compares base prices only between monthly plans in the same currency; usage charges and annual plans vary, so check each plan’s limits.
- What features does each app list that the other doesn’t?
- Arka lists 2 the others don’t mention, such as Funnel analysis, Historical analysis. DOE Labs lists 3 the others don’t mention, such as Analytics dashboard, Checkout analytics, Purchase tracking. A feature missing from a listing may still be supported; this compares what each App Store listing says.
- Where does this comparison’s data come from?
- Shoplist crawls Shopify storefronts to detect which apps each store runs, and reads each app’s Shopify App Store listing for reviews, pricing, features and integrations. Store counts are as of May 22, 2026 for Arka, Nov 5, 2026 for DOE Labs; estimated figures are labeled.
How Shoplist compares apps
Store counts come from Shoplist’s crawl of Shopify storefronts, which detects the apps each store runs; they are as of May 22, 2026 for Arka, Nov 5, 2026 for DOE Labs. Reviews, ratings, plans, features and integrations come from each app’s Shopify App Store listing. 28-day figures are labeled when estimated, and a figure that is missing or estimated never decides who leads. Read the methodology.