

Blog Analytics and Performance vs Snapshot CRO Analytics
Two Shopify apps, side by side: detected stores, momentum, reviews, plans, listed features and who runs each. Store counts as of Nov 4, 2026.
The short answer
- Blog Analytics and Performance is detected on 13× as many Shopify stores as Snapshot CRO Analytics: 13 vs 1 as of Nov 4, 2026.
- Blog Analytics and Performance lists 5 features Snapshot CRO Analytics’s listing doesn’t mention, including AI insights, Custom dashboards, Data export.
Head to head


- United States
- Australia
- United Kingdom
- United States
Momentum
New reviews each month
Review pace is the clearest public read on how fast an app is winning new merchants.
Starter
- · Behavioral tracking by page
- · Full conversion rate tracking
- · Markeing channel audits
- · Session tracking by channel
- · Track up to 1000 visitors per snapshot
Growth
- · A/B testing on page templates
- · Everything in Starter Plan
- · Track up to 10,000 visitors per snapshot
Scale
- · A/B testing on page templates
- · Everything in Growth Plan
- · Track up to 25,000 visitors per snapshot
Coverage counts what each App Store listing names. Every feature, checked off app by app, is in Shoplist.
See every featureMost blog posts get views - but no product clicks. AnalyticsHero shows you views, clicks and engagement in one place - without the complexity of Google Analytics. Understand what works, what doesn’t, and get AI insights on what to improve - automatically.
Optimize your site to convert more visitors into customers by understanding exactly what they are doing on your website.
- Track blog views, reading behavior, engagement, and product clicks per article
- View article-level analytics to understand content performance and engagement
- Get clear recommendations to adjust content structure and calls to action
- Compare articles over time with historical performance insights
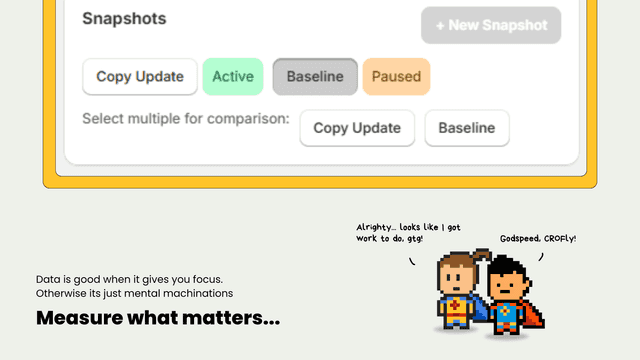
- Create a snapshot of product page visitors in 1-click
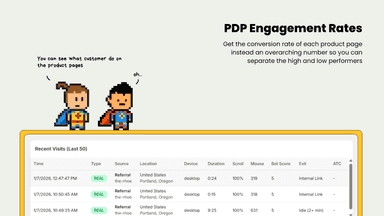
- Analyze on-site behavior and engagement
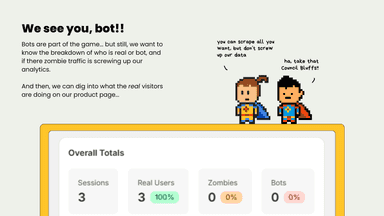
- Non-human traffic is automatically filtered
- Compare snapshots of traffic to measure CRO efforts




All the numbers
Every figure, side by side
A green dot marks the app ahead on a measured figure. Estimates, gaps and apps that leave no storefront trace never take the lead.
Adoption
| Measure |  Blog Analytics and Performance |  Snapshot CRO Analytics |
|---|---|---|
| Detected stores | 13(ahead) | 1 |
| Net store change, 28 days | 0 | 0 |
| Stores added, 28 days | Not enough data | Not enough data |
| Big-brand share | Not enough data | Not enough data |
| Top store categories | Home & Garden, Apparel & Accessories, Sporting Goods | Health & Beauty |
| Top store countries | United States, Australia, United Kingdom | United States |
Reviews
| Measure | Blog Analytics and Performance | Snapshot CRO Analytics |
|---|---|---|
| App Store rating | 2.1 ★ | Not published |
| App Store reviews | 2 | Not published |
| New reviews, 28 days | Not enough data | Not enough data |
| Reviewers a year or more in | Not enough data | Not enough data |
Pricing
| Measure | Blog Analytics and Performance | Snapshot CRO Analytics |
|---|---|---|
| Free plan | Not listed | Not listed |
| Lowest paid monthly plan | No monthly plan listed | $19/month |
| Longest free trial | Not listed | 14 days |
| Plans listed | Not published | 3 |
Listing
| Measure | Blog Analytics and Performance | Snapshot CRO Analytics |
|---|---|---|
| Shopify category rank | #457(ahead) | #838 |
| Shopify App Charts | Not on this week’s charts | Not on this week’s charts |
| Built for Shopify | No | No |
| Launched | Feb 5, 2026 | Jan 29, 2026 |
| Languages | 1 | 1 |
| Developer | BlogHero | The Real Heroes of Ecommerce |
FAQ
Blog Analytics and Performance and Snapshot CRO Analytics: common questions
- Which is more popular, Blog Analytics and Performance or Snapshot CRO Analytics?
- Blog Analytics and Performance is detected on 13× as many Shopify stores as Snapshot CRO Analytics: 13 vs 1 as of Nov 4, 2026.
- What features does each app list that the other doesn’t?
- Blog Analytics and Performance lists 5 the others don’t mention, such as AI insights, Custom dashboards, Data export, Historical analysis. A feature missing from a listing may still be supported; this compares what each App Store listing says.
- Where does this comparison’s data come from?
- Shoplist crawls Shopify storefronts to detect which apps each store runs, and reads each app’s Shopify App Store listing for reviews, pricing, features and integrations. Store counts are as of Nov 4, 2026; estimated figures are labeled.
How Shoplist compares apps
Store counts come from Shoplist’s crawl of Shopify storefronts, which detects the apps each store runs; they are as of Nov 4, 2026. Reviews, ratings, plans, features and integrations come from each app’s Shopify App Store listing. 28-day figures are labeled when estimated, and a figure that is missing or estimated never decides who leads. Read the methodology.