

Amplitude: Customer Analytics vs Exatom Checkout Analytics
Two Shopify apps, side by side: detected stores, momentum, reviews, plans, listed features and who runs each. Store counts as of Nov 9, 2026.
The short answer
- Amplitude is detected on 107× as many Shopify stores as Exatom Checkout Analytics: 321 vs 3 as of Nov 9, 2026.
- Amplitude lists 13 features Exatom Checkout Analytics’s listing doesn’t mention, including Custom dashboards, Custom reports, Forecasting.
Head to head


- United States
- United Kingdom
- India
- Netherlands
- France
Momentum
New reviews each month
Review pace is the clearest public read on how fast an app is winning new merchants.
Free
Base Plan
- · 7500 checkout sessions
Advanced Plan
- · 15000 checkout sessions
Pro plan
- · 30000 checkout sessions
Enterprise Plan
- · 50000 checkout sessions
Coverage counts what each App Store listing names. Every feature, checked off app by app, is in Shoplist.
See every featureGet analytics that empower your teams with self-service insights into which store experiences and customer actions lead to better store conversion rate optimization (CRO.) Go beyond surface-level data and get detailed analytics on user behaviors, attributes, channels, and more. Deep dive into data with funnel analysis segmentation for customer insights optimize your store and marketing campaigns.
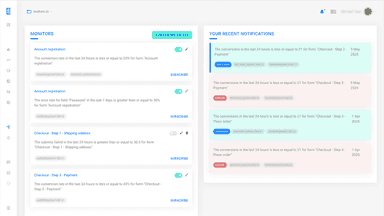
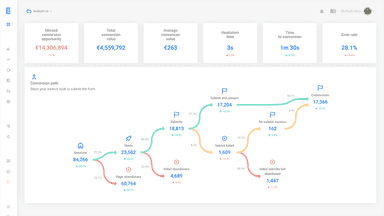
Exatom shows you where checkout friction hides and how to eliminate it. Diagnose drop-offs by step and field, correlate errors to abandonment, and compare your metrics to industry benchmarks to focus on the highest-impact fixes. Cookieless, GDPR-friendly and easy to install, Exatom helps you improve checkout performance in minutes.
- Form & field-level insights on starts, failed submits, drop-offs and conversions
- Error measurement with autofill correlation to pinpoint costly issues
- Autofill adoption and device/browser discrepancy tracking
- Monitoring and real-time alerts to safeguard conversions



All the numbers
Every figure, side by side
A green dot marks the app ahead on a measured figure. Estimates, gaps and apps that leave no storefront trace never take the lead.
Adoption
| Measure |  Amplitude |  Exatom Checkout Analytics |
|---|---|---|
| Detected stores | 321(ahead) | 3 |
| Net store change, 28 days | +5 | 0 |
| Stores added, 28 days | 5 | Not enough data |
| Big-brand share | 21% | Not enough data |
| Top store categories | Apparel & Accessories, Health & Beauty, Home & Garden | Health & Beauty, Home & Garden, Vehicles & Parts |
| Top store countries | United States, United Kingdom, India | Netherlands, France |
Reviews
| Measure | Amplitude | Exatom Checkout Analytics |
|---|---|---|
| App Store rating | 3.3 ★ | Not published |
| App Store reviews | 6 | Not published |
| New reviews, 28 days | Not enough data | Not enough data |
| Reviewers a year or more in | Not enough data | Not enough data |
Pricing
| Measure | Amplitude | Exatom Checkout Analytics |
|---|---|---|
| Free plan | Not listed | Not listed |
| Lowest paid monthly plan | No monthly plan listed | $75/month |
| Longest free trial | Not listed | 15 days |
| Plans listed | 1 | 4 |
Listing
| Measure | Amplitude | Exatom Checkout Analytics |
|---|---|---|
| Shopify category rank | Not enough data | #912 |
| Shopify App Charts | Not on this week’s charts | Not on this week’s charts |
| Built for Shopify | No | No |
| Launched | Oct 20, 2021 | Oct 24, 2025 |
| Languages | 1 | 1 |
| Developer | Amplitude | Exatom BV |
FAQ
Amplitude and Exatom Checkout Analytics: common questions
- Which is more popular, Amplitude or Exatom Checkout Analytics?
- Amplitude is detected on 107× as many Shopify stores as Exatom Checkout Analytics: 321 vs 3 as of Nov 9, 2026.
- What features does each app list that the other doesn’t?
- Amplitude lists 13 the others don’t mention, such as Custom dashboards, Custom reports, Forecasting, Funnel analysis. Exatom Checkout Analytics lists 2 the others don’t mention, such as Benchmarking, Notifications. A feature missing from a listing may still be supported; this compares what each App Store listing says.
- Where does this comparison’s data come from?
- Shoplist crawls Shopify storefronts to detect which apps each store runs, and reads each app’s Shopify App Store listing for reviews, pricing, features and integrations. Store counts are as of Nov 9, 2026; estimated figures are labeled.
How Shoplist compares apps
Store counts come from Shoplist’s crawl of Shopify storefronts, which detects the apps each store runs; they are as of Nov 9, 2026. Reviews, ratings, plans, features and integrations come from each app’s Shopify App Store listing. 28-day figures are labeled when estimated, and a figure that is missing or estimated never decides who leads. Read the methodology.