

COS ‑ Social Share Images vs Kolage
Two Shopify apps, side by side: detected stores, momentum, reviews, plans, listed features and who runs each. Store counts as of Oct 21, 2026 for COS, Oct 13, 2026 for Kolage.
The short answer
- On the Shopify App Store: COS 2.5 from 3 reviews and Kolage 1.0 from 1 reviews.
- Paid plans start at $5/month for COS and $9/month for Kolage.
Head to head


Your personal custom social share images generator
Momentum
New reviews each month
Review pace is the clearest public read on how fast an app is winning new merchants.
Standard plan
- · Add your logo, colors & backgrounds
- · Custom template per page type
- · Share and click counts per page type
- · Theme conflict check with the exact fix
- · Unlimited branded images for every page
Essential Plan
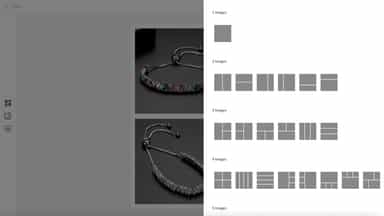
- · +30 Predefined Layouts
- · Custom Layouts
- · Unlimited Collages
- · Unlimited Images
Coverage counts what each App Store listing names. Every feature, checked off app by app, is in Shoplist.
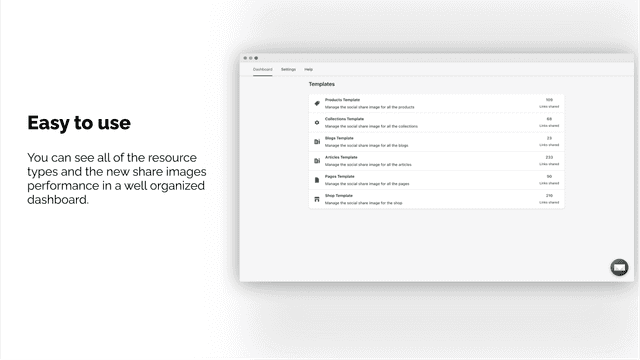
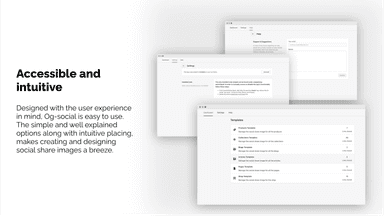
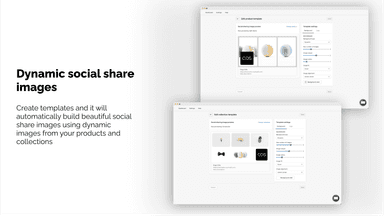
See every featureShared links often show a random photo or none. Build one template per page type (shop, products, collections, pages, blogs, articles) with your logo and backgrounds, and the app serves a 1200x630 image for every link. Most themes print their own share image first, and social networks take that one. The dashboard checks your theme, lists the exact lines to comment out and gives you the corrected file to paste.
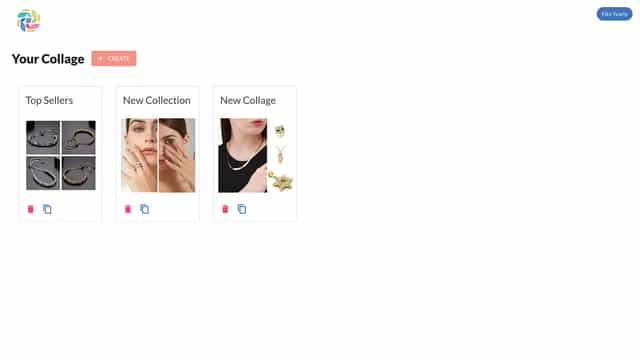
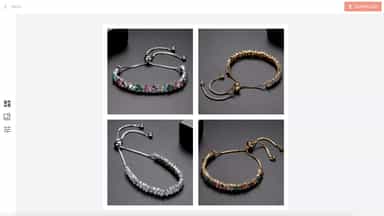
Kolage will help you create stunning collages of your product photos with a few clicks. You can easily combine photos of your best sellers or new products to create promotional images for your website, your email marketing campaigns or your social networks campaigns. Do you need to display multiple images for your variants? Just create beautiful collages of those photos to use them as a variant image.
- Combine multiple product images into a single mosaic-like image.
- Add your store logo alongside any product image
- Simple analytics to monitor each link’s share performance
- Great and fast support
- More than 30 different pre-defined layouts
- Easy drag and drop interface to create custom layouts
- Combine product photos with custom images uploaded from your hard drive
- Choose among +40 dimensions optimized for social networks, emails and websites


All the numbers
Every figure, side by side
A green dot marks the app ahead on a measured figure. Estimates, gaps and apps that leave no storefront trace never take the lead.
Adoption
| Measure |  COS |  Kolage |
|---|---|---|
| Detected stores | Not published | Not published |
| Net store change, 28 days | 0 | 0 |
| Stores added, 28 days | Not enough data | Not enough data |
| Big-brand share | Not enough data | Not enough data |
| Top store categories | Not published | Not published |
| Top store countries | Not published | Not published |
Reviews
| Measure | COS | Kolage |
|---|---|---|
| App Store rating | 2.5 ★(ahead) | 1.0 ★ |
| App Store reviews | 3(ahead) | 1 |
| New reviews, 28 days | Not enough data | Not enough data |
| Reviewers a year or more in | Not enough data | Not enough data |
FAQ
COS and Kolage: common questions
- Is COS or Kolage cheaper?
- Paid plans start at $5/month for COS and $9/month for Kolage. Shoplist compares base prices only between monthly plans in the same currency; usage charges and annual plans vary, so check each plan’s limits.
- Which has better reviews, COS or Kolage?
- On the Shopify App Store: COS 2.5 from 3 reviews and Kolage 1.0 from 1 reviews.
- Where does this comparison’s data come from?
- Shoplist crawls Shopify storefronts to detect which apps each store runs, and reads each app’s Shopify App Store listing for reviews, pricing, features and integrations. Store counts are as of Oct 21, 2026 for COS, Oct 13, 2026 for Kolage; estimated figures are labeled.
How Shoplist compares apps
Store counts come from Shoplist’s crawl of Shopify storefronts, which detects the apps each store runs; they are as of Oct 21, 2026 for COS, Oct 13, 2026 for Kolage. Reviews, ratings, plans, features and integrations come from each app’s Shopify App Store listing. 28-day figures are labeled when estimated, and a figure that is missing or estimated never decides who leads. Read the methodology.