

Adray ‑ AI Campaign Analytics vs ATB: Attribution Reports
Two Shopify apps, side by side: detected stores, momentum, reviews, plans, listed features and who runs each. Store counts as of Oct 22, 2026 for Adray, Nov 9, 2026 for ATB.
The short answer
- ATB lists 6 features Adray’s listing doesn’t mention, including AI insights, Cohort analysis, Custom dashboards.
Head to head


Multi-touch attribution and affiliate tracking for your store


- United States
- Canada
- United Kingdom
Momentum
New reviews each month
Review pace is the clearest public read on how fast an app is winning new merchants.
Pro Plan
- · 1 Store
- · 5 Attribution Models
- · 5 Custom Reports
- · All Ad Connectors
- · Email Support
- · Klaviyo Integration
Coverage counts what each App Store listing names. Every feature, checked off app by app, is in Shoplist.
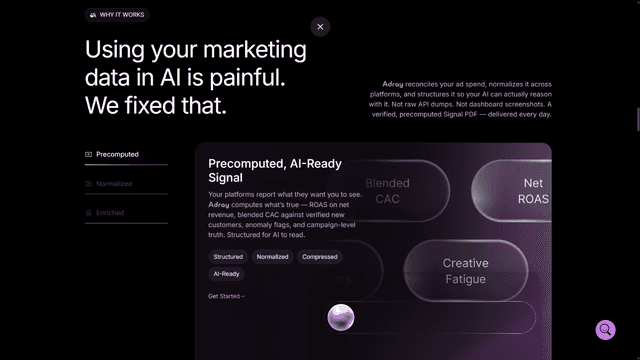
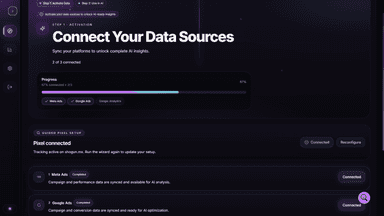
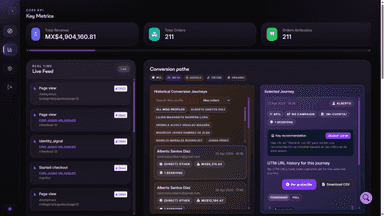
See every featureAdray helps you see which campaigns generate real sales and where shoppers leave without buying. It connects your ad accounts with Shopify orders, so you can compare reported conversions with verified revenue after refunds. See where shoppers get stuck, and ask AI questions about your marketing and sales in plain language.
Attribution tracks the real cost of acquiring each Shopify customer by pulling spend data from ad platform APIs and binding it to individual visitors. The result: deduplicated ROAS that matches your actual Shopify revenue, not inflated platform numbers. See which channels acquire new customers vs re-engage existing ones. Know when each channel's spend breaks even with cohort payback. Ask your data anything via AI.
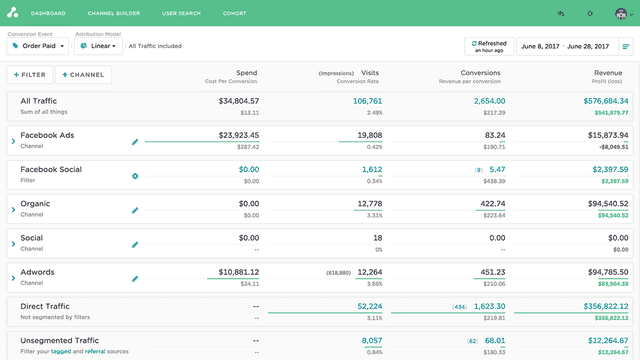
- Multichannel attribution to see which campaigns drive real sales
- Real-time tracking of sessions, events, and orders in one dashboard
- Export attributed orders, sessions, and events to CSV anytime
- Connect all major ad platforms including Meta, Google, Pinterest and TikTok
- Cost, ROAS, and LTV available down to the keyword or ad level for all your ads
- Customizable multi touch models and reports give you complete control

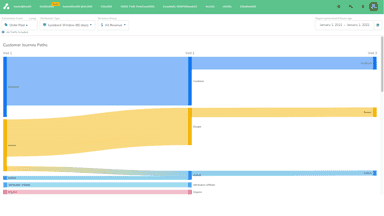


All the numbers
Every figure, side by side
A green dot marks the app ahead on a measured figure. Estimates, gaps and apps that leave no storefront trace never take the lead.
Adoption
| Measure |  Adray |  ATB |
|---|---|---|
| Detected stores | Not published | 29 |
| Net store change, 28 days | 0 | 0 |
| Stores added, 28 days | Not enough data | Not enough data |
| Big-brand share | Not enough data | Not enough data |
| Top store categories | Not published | Business & Industrial, Food, Beverages & Tobacco, Apparel & Accessories |
| Top store countries | Not published | United States, Canada, United Kingdom |
Reviews
| Measure | Adray | ATB |
|---|---|---|
| App Store rating | Not published | 4.8 ★ |
| App Store reviews | Not published | 9 |
| New reviews, 28 days | Not enough data | 0 |
| Reviewers a year or more in | Not enough data | Not enough data |
FAQ
Adray and ATB: common questions
- What features does each app list that the other doesn’t?
- Adray lists 3 the others don’t mention, such as Abandoned cart, Activity tracking, Purchase tracking. ATB lists 6 the others don’t mention, such as AI insights, Cohort analysis, Custom dashboards, Custom reports. A feature missing from a listing may still be supported; this compares what each App Store listing says.
- Where does this comparison’s data come from?
- Shoplist crawls Shopify storefronts to detect which apps each store runs, and reads each app’s Shopify App Store listing for reviews, pricing, features and integrations. Store counts are as of Oct 22, 2026 for Adray, Nov 9, 2026 for ATB; estimated figures are labeled.
How Shoplist compares apps
Store counts come from Shoplist’s crawl of Shopify storefronts, which detects the apps each store runs; they are as of Oct 22, 2026 for Adray, Nov 9, 2026 for ATB. Reviews, ratings, plans, features and integrations come from each app’s Shopify App Store listing. 28-day figures are labeled when estimated, and a figure that is missing or estimated never decides who leads. Read the methodology.