
Add TIME! vs Help1 Diagnostics
Two Shopify apps, side by side: detected stores, momentum, reviews, plans, listed features and who runs each. Store counts as of Oct 27, 2026 for Add TIME!, Aug 12, 2026 for Help1 Diagnostics.
The short answer
Head to head


Free
Scale
Performance
Growth
Coverage counts what each App Store listing names. Every feature, checked off app by app, is in Shoplist.
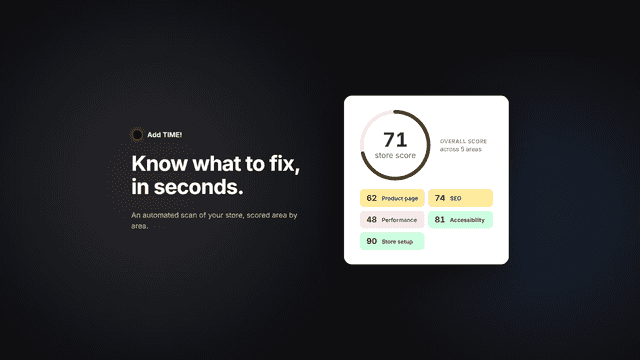
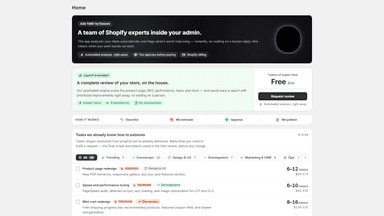
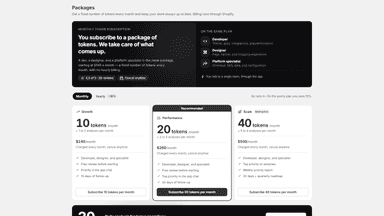
See every featureAdd TIME! runs an automated analysis of your store and flags what's worth improving in seconds. Browse a catalog of ready-made tasks, from small fixes to bigger projects, handled by a dev, designer, or platform specialist. Reviews and case studies from other merchants show past work.
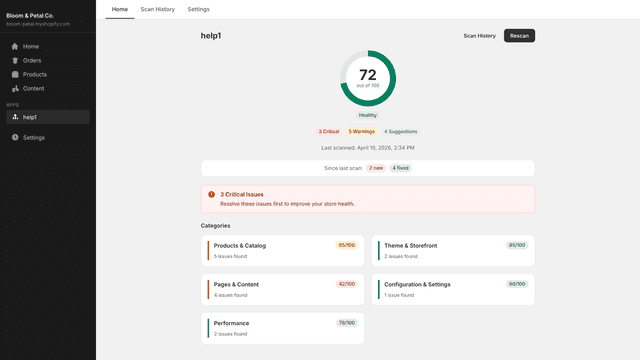
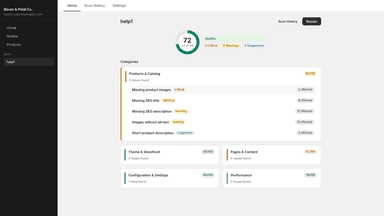
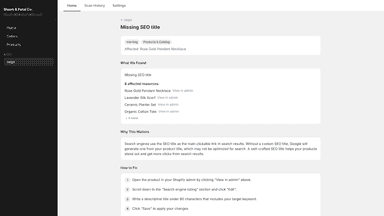
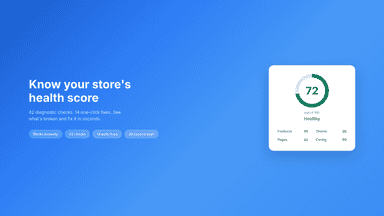
Help1 runs 42 diagnostic checks across products, theme, pages, configuration, and performance - then gives you a health score from 0 to 100. Every issue comes with clear fix instructions. 14 common problems can be fixed with one click: product SEO titles, descriptions, image alt text, missing pages, favicon, social image, deprecated tags, unused themes, and redirect chains.
- Automated store analysis in seconds — no forms, no waiting
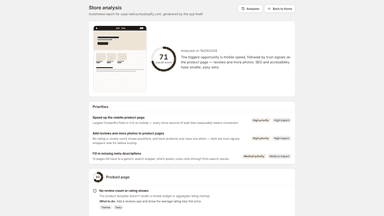
- Scores for SEO, performance, accessibility, and product pages
- Prioritized action list ranked by impact and effort
- Full history of past analyses, with score and date
- 42 checks across products, theme, content, config, and performance
- 14 one-click auto-fixes - no manual admin work needed
- Health score 0-100 with color-coded severity and category breakdown
- Full scan history with trend chart and new/fixed issue tracking
All the numbers
Every figure, side by side
A green dot marks the app ahead on a measured figure. Estimates, gaps and apps that leave no storefront trace never take the lead.
Adoption
| Measure |  Add TIME! |  Help1 Diagnostics |
|---|---|---|
| Detected stores | Not published | Not published |
| Net store change, 28 days | 0 | 0 |
| Stores added, 28 days | Not enough data | Not enough data |
| Big-brand share | Not enough data | Not enough data |
| Top store categories | Not published | Not published |
| Top store countries | Not published | Not published |
Reviews
| Measure | Add TIME! | Help1 Diagnostics |
|---|---|---|
| App Store rating | 5.0 ★ | Not published |
| App Store reviews | 1 | Not published |
| New reviews, 28 days | Not enough data | Not enough data |
| Reviewers a year or more in | Not enough data | Not enough data |
Pricing
| Measure | Add TIME! | Help1 Diagnostics |
|---|---|---|
| Free plan | Not listed | Not listed |
| Lowest paid monthly plan | $19/month | No monthly plan listed |
| Longest free trial | Not listed | Not listed |
| Plans listed | 4 | Not published |
Listing
| Measure | Add TIME! | Help1 Diagnostics |
|---|---|---|
| Shopify category rank | #67(ahead) | #102 |
| Shopify App Charts | Not on this week’s charts | Not on this week’s charts |
| Built for Shopify | No | No |
| Launched | Sep 29, 2026 | May 19, 2026 |
| Languages | 2 | 1 |
| Developer | Elabore Digital | Koala Apps |
FAQ
Add TIME! and Help1 Diagnostics: common questions
- Where does this comparison’s data come from?
- Shoplist crawls Shopify storefronts to detect which apps each store runs, and reads each app’s Shopify App Store listing for reviews, pricing, features and integrations. Store counts are as of Oct 27, 2026 for Add TIME!, Aug 12, 2026 for Help1 Diagnostics; estimated figures are labeled.
How Shoplist compares apps
Store counts come from Shoplist’s crawl of Shopify storefronts, which detects the apps each store runs; they are as of Oct 27, 2026 for Add TIME!, Aug 12, 2026 for Help1 Diagnostics. Reviews, ratings, plans, features and integrations come from each app’s Shopify App Store listing. 28-day figures are labeled when estimated, and a figure that is missing or estimated never decides who leads. Read the methodology.